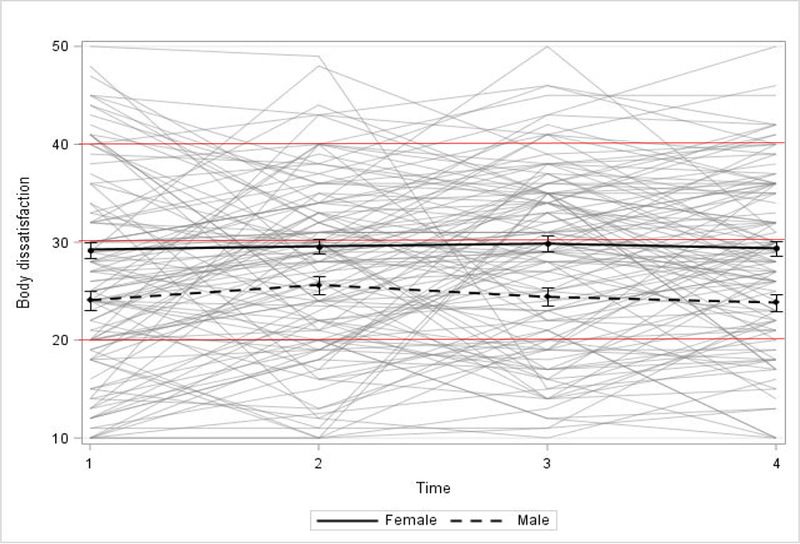
Figure 1.

Average levels of body dissatisfaction for males and females, with 95% confidence intervals; higher scores indicate greater body dissatisfaction.
Note. Average levels of body dissatisfaction (dark black lines) are overlaid on spaghetti plots for a random subset of participants (light grey lines). Figure is adjusted for overweight status, age, socioeconomic status, and race. Body dissatisfaction was measured with a 10-item scale assessing participants’ satisfaction with various body parts; higher scores indicate greater body dissatisfaction (range = 10 – 50). On average, participants were 14.9 years old at Time 1, 19.3 at Time 2, 25.2 at Time 3, and 31.0 at Time 4.
