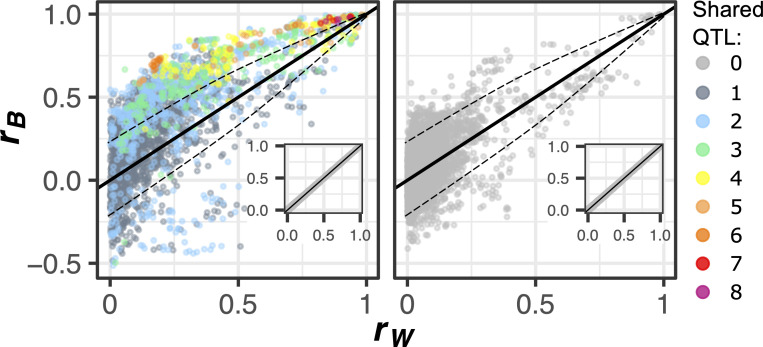
Fig 3. Natural genetic variation affects the correlation between morphological features.
The absolute value of the between-strain correlation (rB), made negative when rB and rW have opposite signs, is plotted against the absolute value of the within-strain correlation (rW), for each pair of traits. The plot at left shows pairs of traits that share at least one QTL influence. The color of each point represents the number of pleiotropic QTL that influence both traits in that pair. The plot at right shows pairs of traits that share no QTL influence. The dashed line represents a Bonferroni-corrected significance threshold of p < 0.01. Insets represent the results of correlation partitioning performed after randomly assigning individual cells to groups (pseudo-strains) having the same numbers of cells as the actual strains. Data underlying this figure can be found at https://osf.io/b7ny5/. QTL, quantitative trait loci.

