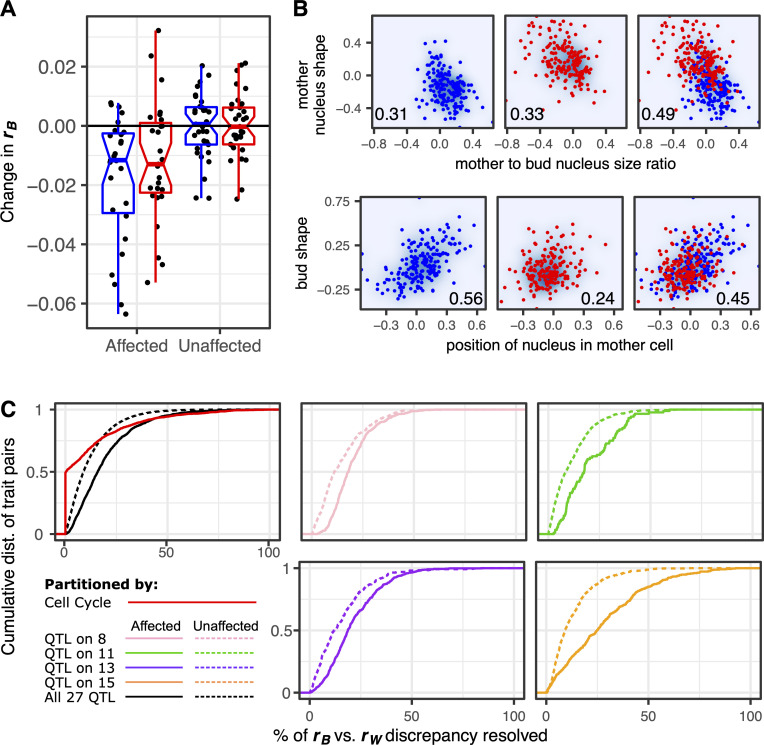
Fig 5. Many QTL demonstrate horizontal pleiotropy.
(A) Eliminating allelic variation at the site of each QTL tends to reduce rB. The vertical axis represents how rB changes upon eliminating allelic variation at each QTL site. Each point represents the median change in rB for all pairs of traits that are affected or unaffected by one of the 27 QTL suspected of horizontal pleiotropy. Box plots summarize these changes in rB when remeasured across strains possessing the wine (red) or the oak (blue) allele at the marker closest to the QTL. (B) The upper and lower series of three plots demonstrate two different ways that a QTL can increase the correlation between traits. Each point represents a yeast strain possessing either the wine (red) or the oak (blue) allele at a marker closest to a QTL on chromosome 15 (upper) or 8 (lower). In the upper plots, the QTL increases the correlation between nucleus shape and size ratio when it is segregating across strains. In the lower plots, the oak allele strengthens a correlation between bud shape and the position of the nucleus in the mother cell that is weak in the wine subpopulation. Numbers in the lower corner of each plot represent rB for the strains displayed. (C) Cumulative distributions (“dist.”) display the extent to which binning cells or splitting strains resolves the difference between rB and rW. When calculating percent resolved (horizontal axes), we always plot the value in whichever subset (e.g., wine or oak) this percent is greatest. If subsetting always worsens the discrepancy between rB versus rW, we score this as 0% resolution. Only pairs of traits for which rB is significantly greater than rW are considered. The pink, green, purple, and orange lines show the effect of splitting strains by whether they inherited the wine or oak allele at the marker closest to each of four QTL (colors correspond to QTL in Fig 1A). In these plots, comparing the solid versus dotted lines shows that splitting strains resolves the discrepancy between rB and rW more often for pairs in which both traits are affected by the QTL than pairs in which both traits are unaffected. The black lines in the leftmost plot summarize these effects across 27 QTL, displaying for each trait pair the largest resolution in the rB versus rW discrepancy observed across all QTL that affect the pair of traits (solid line) or all QTL that do not (dotted line). The red line shows the effect of binning cells by their progress through division, displaying the largest resolution in the rB versus rW difference across all 16 bins. Data underlying this figure can be found at https://osf.io/b7ny5/. QTL, quantitative trait loci.

