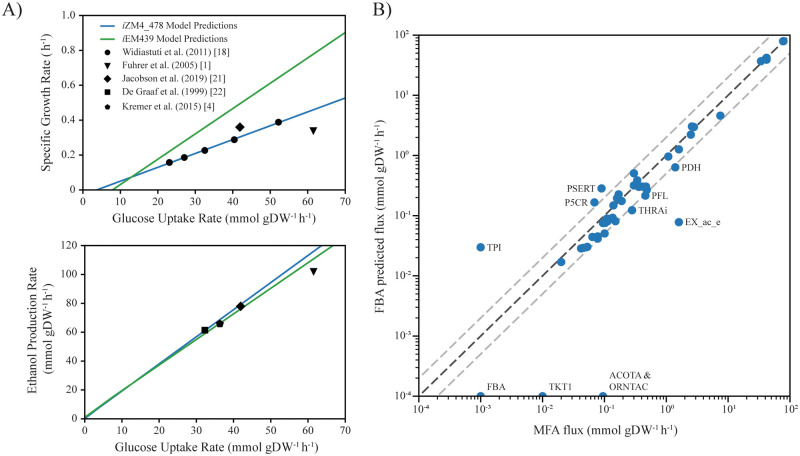
Fig 1. Model predictions for growth, ethanol and central metabolic fluxes.
(A) Comparison between model predicted (solid lines) and reported experimental (data points) specific growth rates (top) and ethanol production rates (bottom) against glucose uptake rates for published anaerobic glucose minimal media experiments. Simulation ready models for iZM363, iZM411, and iZmobMBEL601 were not available with their respective publications. (B) Plot of the predicted fluxes based on FBA versus the fluxes found via metabolic flux analysis in Jacobson et al. FBA was run for anaerobic growth in minimal media with a constraint preventing lactate production, forcing flux to ethanol as the primary fermentation product. Flux variability as determined by FVA at the optimal FBA growth rate is less than the size of the markers for each reaction. Grey dashed lines represent a 2-fold change in flux in either direction, reactions falling outside of these boundaries are labeled with their reaction IDs from iZM4_478 (where ACOTA is acetylornithine transaminase, EX_ac_e is acetate exchange, FBA is fructose-bisphosphate aldolase, ORNTAC is ornithine transacetylase, P5CR is pyrroline-5-carboxylate reductase, PDH is pyruvate dehydrogenase, PFL is pyruvate formate lyase, PSERT is phosphoserine transaminase, THRAi is threonine aldolase, TKT1 is transketolase reaction involving sedoheptulose-7-phosphate, and TPI is the triose-phosphate isomerase). Reactions with zero flux in the FBA solution are plotted at 10−4 in the log space.

