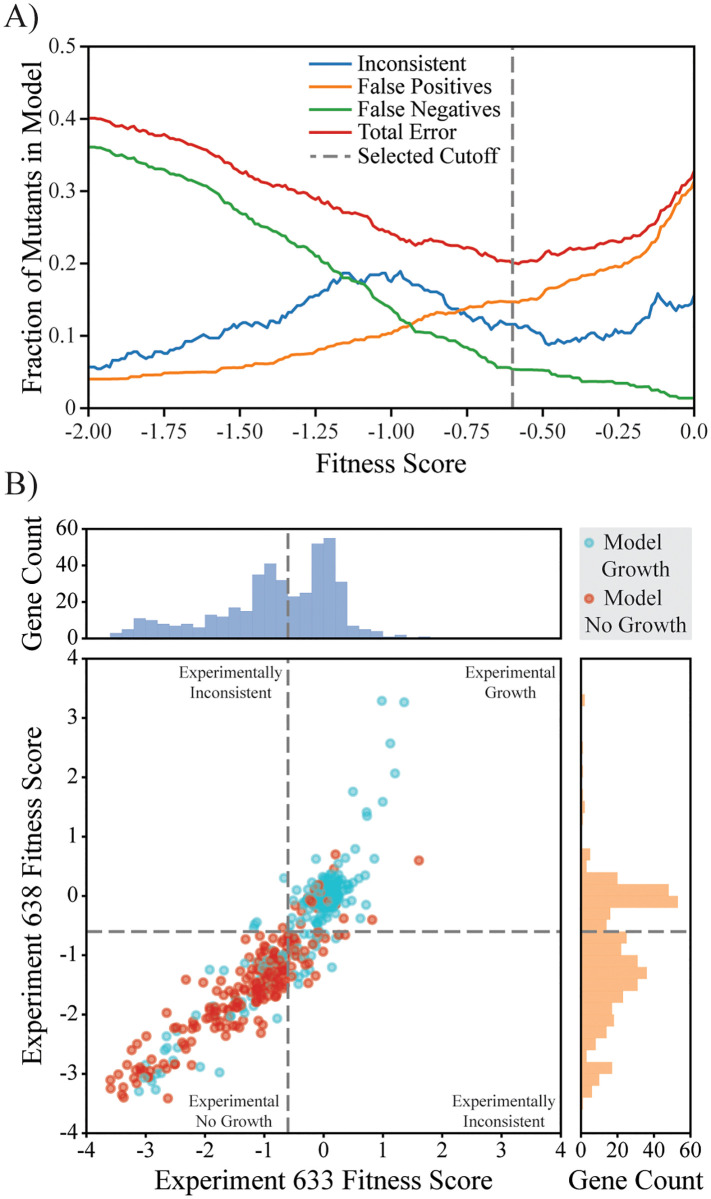
Fig 2. Comparison of model predictions to pooled fitness data.
(A) Analysis of the effect of fitness score cutoff for growth phenotype classification of the pooled growth experiments. The fraction of genes with inconsistent growth phenotypes (i.e., above the cutoff in one experiment and below in the other) is shown in blue, the fraction of false positives (model predicts growth, but categorized as no growth experimentally, i.e., GNG mutants) in orange, the fraction of false negatives (model predicts no growth, but categorized as growing experimentally, NGG mutants) in green, and the total model prediction error (combination of false positive and negatives) is shown in red. The vertical dashed grey line represents the selected fitness score cutoff of -0.6 which minimizes the total error. (B) The fitness scores for genes included in iZM4_478 for the two anaerobic glucose minimal media experiments (Exp. 633 and Exp. 638) are shown as a scatter plot and histograms. The fitness cutoff used for growth classification is shown as dashed grey lines. Genes in the scatter plot are colored based on model growth predictions, with cyan being genes predicted to be non-essential and red being genes predicted to be essential. Genes in the upper-left and lower-right quadrants of the scatter plot are genes where the growth phenotypes are inconsistent between the two experiments.

