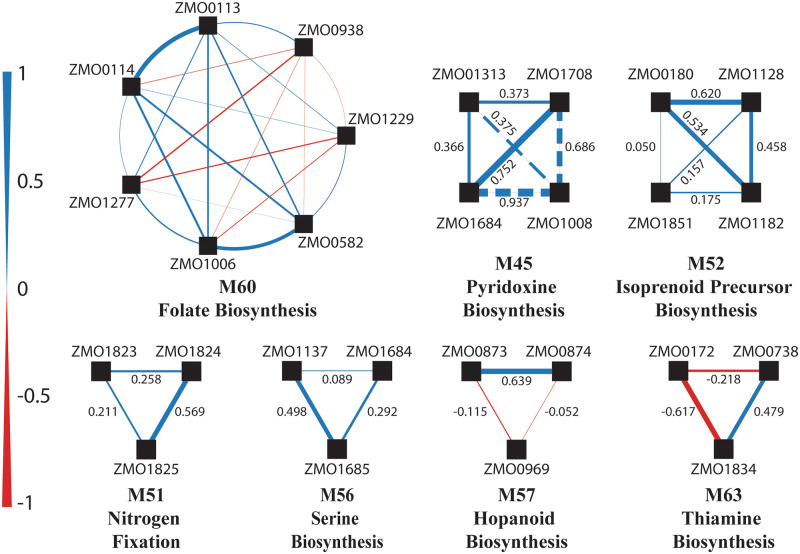
Fig 4. Pairwise cofitness in poorly correlating modules.
The seven poorly correlating modules are represented as node and edge plots. Each node (black square) is a gene within the module, while each edge between nodes represents the cofitness for that pair of genes. Edges in blue represent positive cofitness and edges in red negative cofitness. Edge thickness correspond to the value of cofitness. These pairwise cofitness values are shown for smaller modules. In Module 45, the gene ZMO1008 was identified via MEGS during model development and is shown here with dashed lines.

