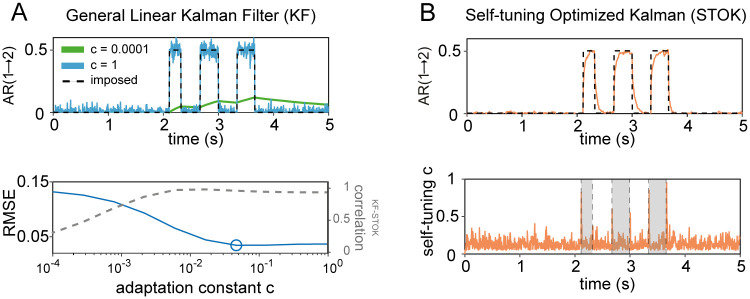
Fig 1. Performance of KF and STOK on a simple simulated bivariate AR(1) process.
(A) Performance of the KF filter at recovering the imposed structure of AR coefficients (top panel; black dashed lines) under two extreme values of the adaptation constant (c = 0.0001, c = 1), highlighting the drastic variability of the estimates as a function of c: poor tracking performance is observed at the lowest (green line) and spurious noisy fluctuations at the highest c (blue line). The optimal c that minimizes the root-mean squared error (RMSE, blue line), lies at a point where KF and STOK performance are highly correlated (bottom panel; correlation shown by the grey dashed line). (B) Performance of the STOK filter, showing the high tracking ability and robustness to noise due to the self-tuning memory decay (top panel; orange line) which automatically increases tracking speed at relevant transition points between AR coefficient states (bottom panel; grey rectangles).

