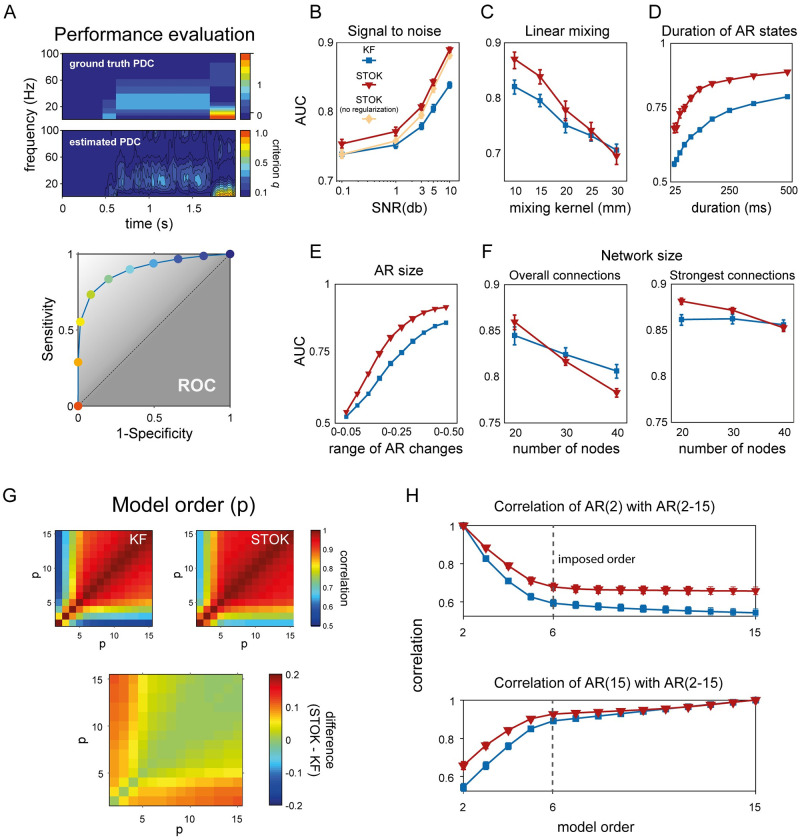
Fig 2. Comparison of the KF and STOK filters under the realistic simulation framework.
(A) Method for evaluating the performance of KF and STOK against simulated data (ground truth). Ground truth PDC was binarized setting to 1 all connections larger than 0. Estimated Partial Directed Coherence (PDC) [41] was binarized using different criteria, based on the quantile discretization of the estimates (criterion q; top panel). Signal detection indexes were calculated for each criterion and the area under the curve (AUC) was used as performance measure. The color code of the dots in the ROC plot (bottom panel) reflects the different criteria and correspond to the colorbar for estimated PDC strength (top panel). (B) Comparison of KF, STOK without regularization and STOK as a function of different SNR, showing the overall larger AUC using STOK. Error bars reflect 95% confidence intervals. (C) AUC curves for KF and STOK as a function of linear mixing. (D-E) Performance of the two filters as a function of the duration (D) and size (E) of AR coefficients. (F) Performance of the two filters with increasing sample size: regularization favors strongest connections and sparse networks as the network size increases (right panel), reducing overall weakest connections (left panel). (G) Correlation matrices at varying model orders for KF and STOK (top two panels) and their difference (bottom panel, STOK minus KF). (H) Correlations extracted at specific orders (p ∈ [2,15], with ground-truth model order = 6) showing the higher consistency of models estimated as p changes with STOK compared with KF.

