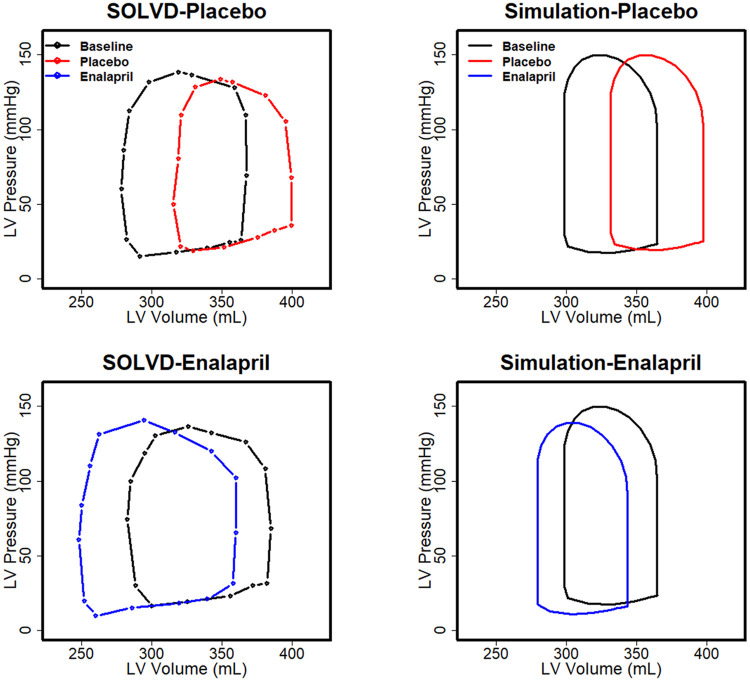
Fig 1. Observed (left) and simulated (right) pressure-volume loops in HF-rEF patients in the SOLVD study at baseline and after 1 year of treatment with placebo or enalapril [42].
The model reproduces the baseline P-V loop, rightward shift over time in the placebo group, and the leftward shift in the enalapril group.

