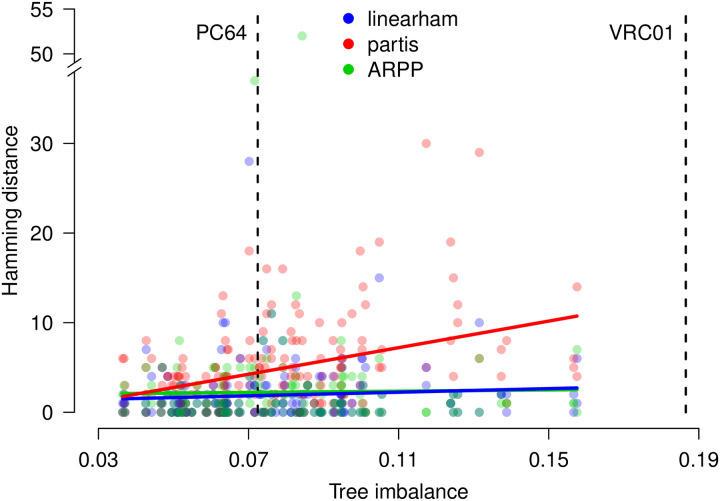
Fig 1. Naive sequence validation plot.
The hamming distances between the simulated naive DNA sequences and their corresponding linearham, partis, and ARPP estimates versus the tree imbalance values of the simulated trees. Linear regression lines are superimposed for each method to indicate how the results vary as trees get more imbalanced. For reference, we plot the tree imbalance values for the PC64 and VRC01 trees.

