Figure 2:

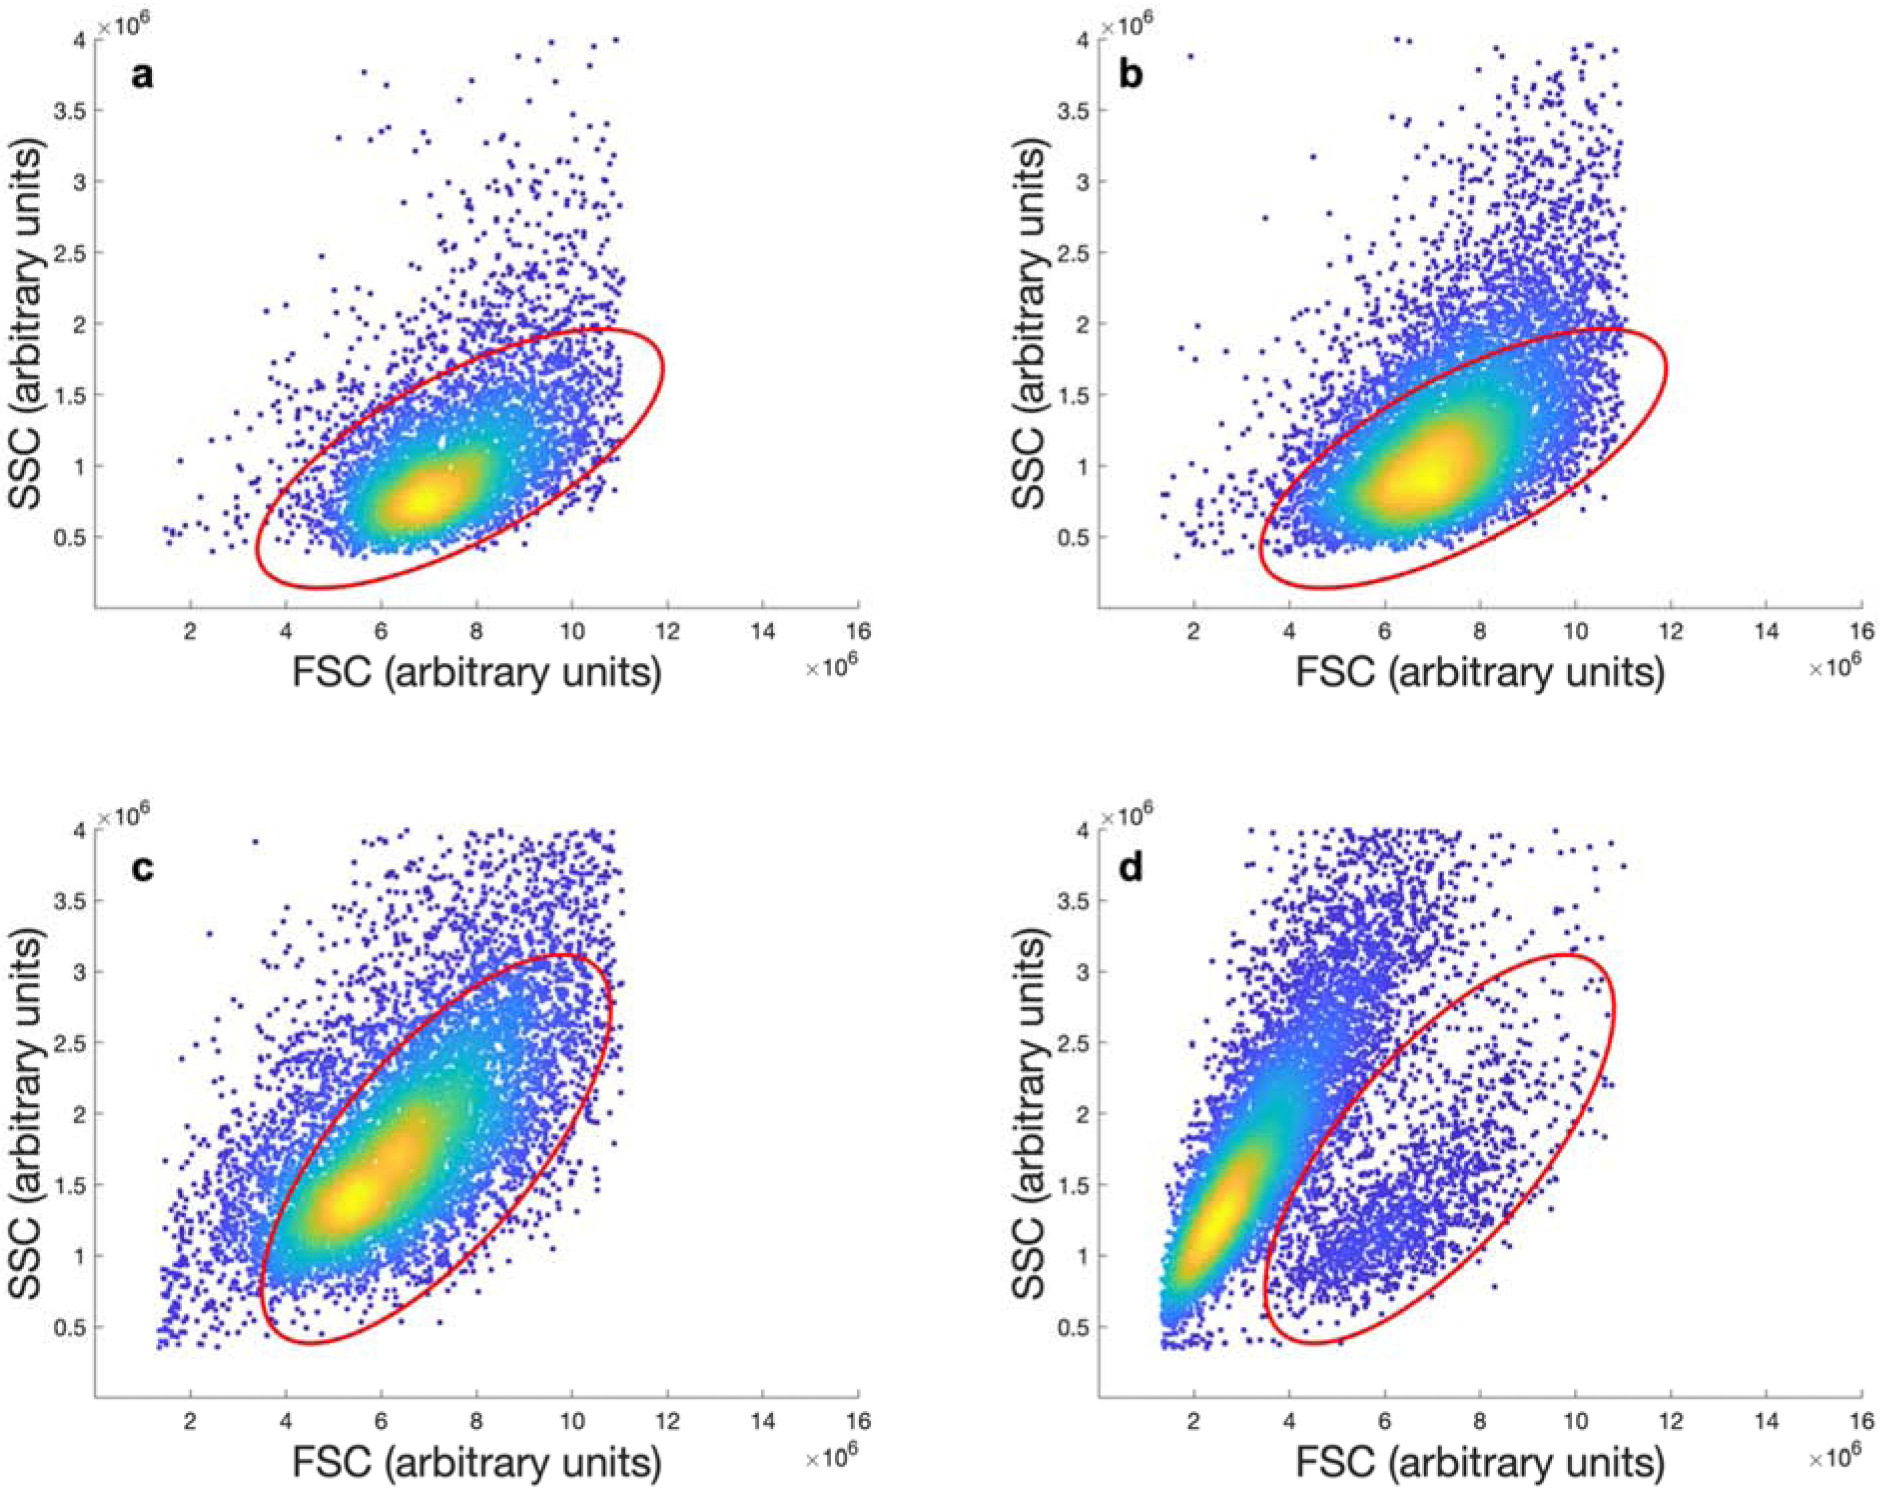
Sample gating of flow cytometry scatter plots for PEGDA 2000 coated cells without (a) and with (b) extrusion, and uncoated cells without (c) and with (d) extrusion. The gated regions indicate the position of cells that are intact.

Sample gating of flow cytometry scatter plots for PEGDA 2000 coated cells without (a) and with (b) extrusion, and uncoated cells without (c) and with (d) extrusion. The gated regions indicate the position of cells that are intact.