
Figure 5:
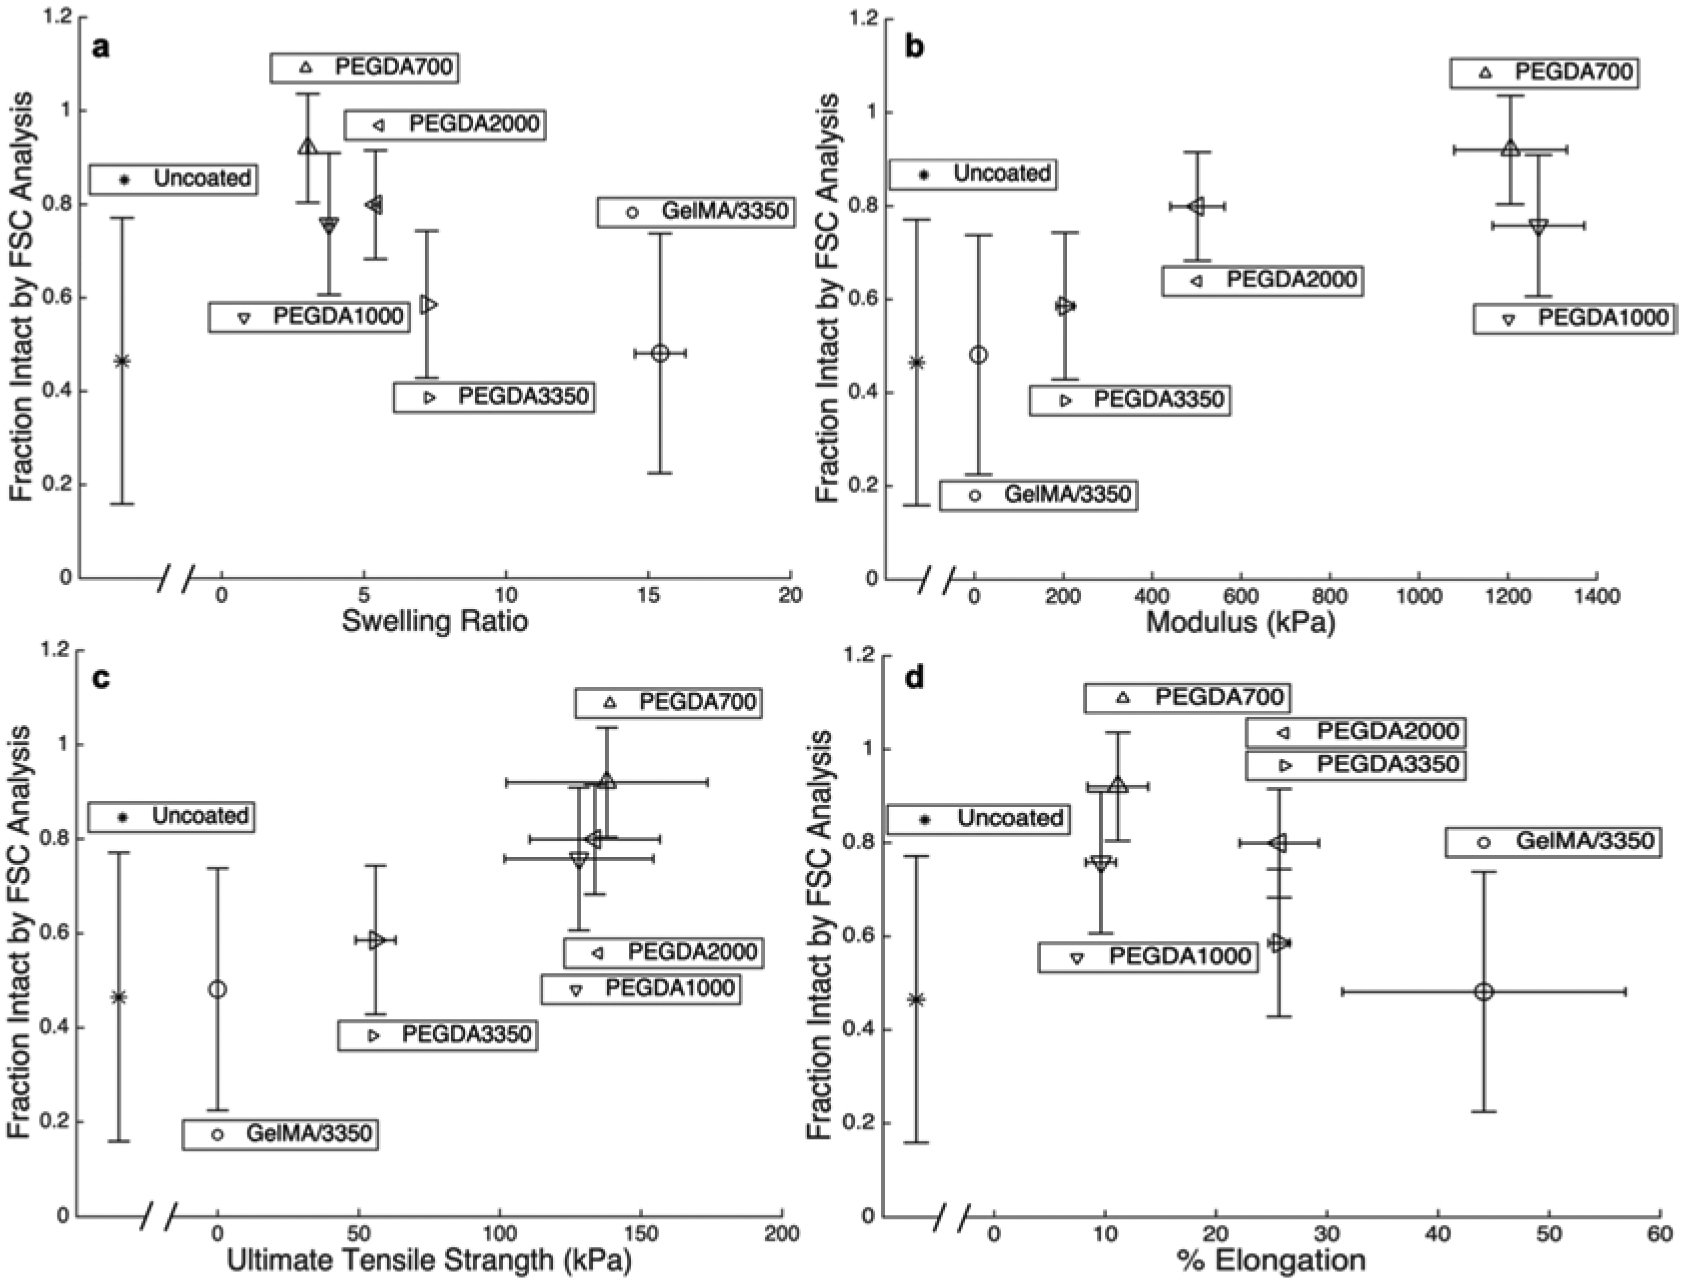
Fraction of cells remaining intact by FSC analysis following extrusion plotted against a) swelling ratio, b) modulus, c) UTS, and d) percent elongation at failure for each of the five macromers studied as well as uncoated cells. Each point are mean values and error bar are standard deviations.