

Abstract
Small RNAs derived from tRNAs are attracting considerable attention; however, the effects of tRNA-derived fragments (tRFs) and tRNA halves (tiRNAs) as biomarkers have not been investigated in early-stage breast cancer (EBC). The study aimed to explore whether tRFs and tiRNAs could be detected in plasma and whether they could serve as diagnostic biomarkers. The study was conducted in four phases. Thirty tRFs and tiRNAs were selected by high-throughput sequencing in screening phase and then assessed in training, testing, and external validation phases by qRT-PCR. Six tRFs (tRF-Glu-CTC-003, tRF-Gly-CCC-007, tRF-Gly-CCC-008, tRF-Leu-CAA-003, tRF-Ser-TGA-001, and tRF-Ser-TGA-002) were found significantly downregulated in plasma samples of patients with EBC compared with normal controls, and all were derived from 5′ ends of tRNAs. Patients with HER2+ EBC with low expression levels of tRF-Glu-CTC-003 were related to worse disease-free survival and overall survival. The identified tRFs were further examined in cell supernatants, exosomes isolated from plasma, and tissues. In conclusion, our study identified six tRFs from the 5′ ends of tRNAs as novel diagnostic biomarkers for EBC, providing additional evidence for, and a better understanding of, circulating tRFs and EBC.
Keywords: tRNA fragments, breast cancer, diagnosis, noninvasive detection, biomarker
Graphical Abstract
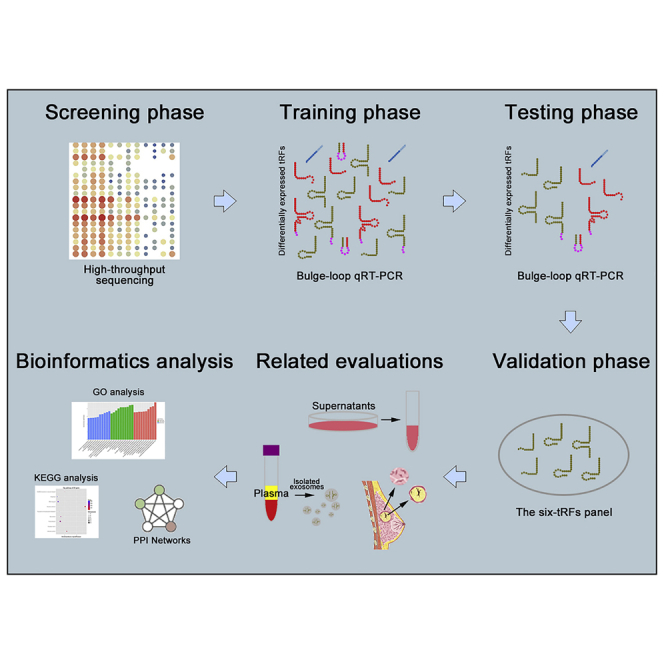
Wang et al. identified six tRFs from the 5′ ends of tRNAs for the diagnosis of early-stage breast cancer (EBC) through a four-phase study. They also analyzed these biomarkers in different subtypes and evaluated the expression levels in exosomes, tissues, and so on. These data provided novel strategies for the diagnosis of EBC.
Introduction
Breast cancer (BC) is the most common cancer and the second leading cause of cancer-related death among women.1 The screening methods for BC are primarily mammography, ultrasound, and MRI.2,3 These methods have several limitations, such as radiation, invasiveness, and inconvenience.4 All methods require a minimum tumor volume for detection, which could miss early-stage cancer and translate into advanced stage. Early-stage BC (EBC) refers to BC that has not spread beyond the breast or the axillary lymph nodes, including ductal carcinoma in situ and stage I, stage IIA, stage IIB, and stage IIIA BC. The 5-year relative survival rate for stage I BC approaches 98%, whereas the rate for stage IV BC declines to 26%.5 Therefore, the diagnosis of EBC has great clinical significance. Liquid biopsy is non-invasive and is conducive to early diagnosis, personalized treatment, and disease monitoring.6 Common tumor markers, such as carcinoembryonic antigen (CEA), CA125, and CA153, can be used for screening, but these markers lack sensitivity and specificity. Materials derived from tumors include circulating tumor cells (CTCs), proteins, RNAs, and extracellular vesicles.7, 8, 9, 10 Some studies have focused on the diagnostic and prognostic functions of extracellular RNA, mainly microRNAs.11, 12, 13 However, few studies have focused on tRNA-derived fragments (tRFs) and tRNA halves (tiRNAs) for the diagnosis and prognosis of BC, not to mention EBC.
tRNAs are non-coding RNAs that recognize codons on mRNA by their own anti-codons and transfer corresponding amino acids to the polypeptide chain in the ribosome. Small RNAs derived from precursor or mature tRNAs, including tRFs and tiRNAs, are attracting considerable attention. tRFs and tiRNAs have an abundance of methylation modifications and terminal modifications and are more stable than other small RNAs. Based on their biogenesis, tRFs include tRF-1, tRF-3, tRF-5, and i-tRF, and tiRNAs include 5′ tiRNA and 3′ tiRNA. These tRFs and tiRNAs are heterogeneous in biogenesis, length, and function. Several lines of evidence indicate that tRFs and tiRNAs have a variety of biological functions, not only related to signal regulation but also involved in various diseases, such as tumors, neurodegenerative diseases, metabolic diseases, and infectious diseases.14, 15, 16, 17 Recent studies have revealed that tRFs can be found in circulation, indicating that tRFs are potential biomarkers for the diagnosis and prognosis of cancers.18,19
The aim of this study was to explore whether tRFs and tiRNAs could be detected in plasma and whether they could serve as diagnostic biomarkers for EBC. We found that six tRFs belonging to the tRF-5 class were significantly downregulated in plasma samples of patients with EBC compared with normal controls (NCs). The identified tRFs were further evaluated in cell supernatants, exosomes isolated from plasma, and tissues. In addition, the associations between different subtypes were assessed, along with other clinicopathological features. The findings of this study provide more choices for the diagnosis and prognosis of EBC.
Results
Characteristics of Study Subjects
A total of 316 plasma samples (176 patients with EBC and 140 NCs) and 35 paired tissues were included in our study (Figure 1). The clinical characteristics of all participants were shown in Table 1. Plasma samples were analyzed in four phases: the screening phase, the training phase, the testing phase, and the external validation phase. There was no significant difference in age distribution between patients with EBC and NCs at any phase (p > 0.05).
Figure 1.

Flowchart of the Experimental Design
BC, breast cancer; NC, normal control.
Table 1.
Clinical Characteristics of Individuals Contributing 316 Plasma Samples and 35 Paired Tissue Samples in the Study
| Characteristics |
Screening Phase |
Training Phase |
Testing Phase |
External Validation Phase |
Tissue Samples |
||||
|---|---|---|---|---|---|---|---|---|---|
| BC (%) |
NC (%) |
BC (%) |
NC (%) |
BC (%) |
NCs (%) |
BC (%) |
NCs (%) |
BC (%) |
|
| Number | 8 | 4 | 24 | 24 | 120 | 88 | 24 | 24 | 35 |
| Age (years) | |||||||||
| <50 | 4 (50.0) | 2 (50.0) | 14 (58.3) | 12 (50.0) | 44 (36.7) | 46 (52.3) | 15 (62.5) | 11 (45.8) | 15 (42.9) |
| ≥50 | 4 (50.0) | 2 (50.0) | 10 (41.7) | 12 (50.0) | 76 (63.3) | 42 (47.7) | 9 (37.5) | 13 (54.2) | 20 (57.1) |
| TNM Stage | |||||||||
| In situ | 2 (25.0) | 2 (8.3) | 11 (9.2) | 2 (8.3) | 3 (8.6) | ||||
| I | 1 (12.5) | 1 (4.2) | 32 (26.7) | 5 (20.8) | 8 (22.9) | ||||
| II | 3 (37.5) | 13 (54.2) | 56 (46.7) | 13 (54.2) | 16 (45.7) | ||||
| III | 2 (25.0) | 8 (13.3) | 21 (17.5) | 4 (16.7) | 8 (22.9) | ||||
| Grade | |||||||||
| I | 2 (25.0) | 1 (4.2) | 12 (10.0) | 2 (8.3) | 3 (8.6) | ||||
| II | 4 (50.0) | 13 (54.1) | 59 (49.2) | 8 (33.4) | 14 (40.0) | ||||
| III | 2 (25.0) | 10 (41.7) | 49 (40.8) | 14 (58.3) | 18 (51.4) | ||||
| Ki-67 | |||||||||
| ≤20% | 3 (37.5) | 10 (41.7) | 17 (14.2) | 6 (25.0) | 7 (20.0) | ||||
| >20% | 5 (62.5) | 14 (58.3) | 103 (85.8) | 18 (75.0) | 28 (80.0) | ||||
| Subtype | |||||||||
| Luminal | 3 (37.5) | 19 (79.2) | 40 (33.3) | 11 (45.8) | 11 (31.4) | ||||
| Triple-negative | 2 (25.0) | 2 (8.3) | 34 (28.3) | 4 (16.7) | 15 (42.9) | ||||
| HER2-enriched | 1 (12.5) | 1 (4.2) | 35 (29.2) | 6 (25.0) | 6 (17.1) | ||||
| In situ | 2 (25.0) | 2 (8.3) | 11 (9.2) | 3 (12.5) | 3 (8.6) | ||||
| Lymph Node | |||||||||
| 0 | 3 (37.5) | 16 (66.7) | 65 (54.2) | 13 (54.2) | 15 (42.9) | ||||
| >0 | 5 (62.5) | 8 (33.3) | 55 (45.8) | 11 (45.8) | 20 (57.1) | ||||
Identification of Endogenous Reference in Plasma Samples
The potential endogenous references (microRNA [miR]-16-5p, miR-1228-3p, miR-103a-3p, U6, and miR-191-5p) were first examined and analyzed by GeNorm because they were reported to represent little variation and indicate high stability.20, 21, 22, 23 miR-103a-3p and miR-191-5p both yielded the lowest M values (Figure S1) and could be used as appropriate endogenous references. Based on the results of GeNorm analysis and threshold cycle (Ct) values (means ± SD) for each reference (miR-103a-3p: 33.23 ± 2.46 and miR-191-5p: 28.93 ± 2.34), miR-191-5p was selected as the endogenous reference.
Profiling of Plasma tRFs and tiRNAs
High-throughput sequencing was used to screen differentially expressed tRFs and tiRNAs, and 30 tRFs and tiRNAs were selected based on fold changes and p values. The selected tRFs and tiRNAs were assessed in 48 plasma samples (24 patients with EBC and 24 NCs) in the training phase (Table S1). Twelve tRFs were found significantly dysregulated (p < 0.05) and were validated in a larger cohort in the testing phase (120 patients with EBC and 88 NCs) (Table S2). Notably, six tRFs from the 5′ ends of tRNAs were expressed at lower levels in plasma samples from patients with EBC than they were in NCs. Combining the training and testing phases, tRF-Glu-CTC-003, tRF-Gly-CCC-007, tRF-Gly-CCC-008, tRF-Leu-CAA-003, tRF-Ser-TGA-001, and tRF-Ser-TGA-002 were significantly downregulated in plasma samples of patients with EBC (Table 2), and the relative expression levels are shown in Figures 2A–2F. To further assess those results, the external validation phase, an external cohort that included 24 patients with EBC and 24 NCs from another hospital, was employed to verify the reliability and reproducibility (Table S3).
Table 2.
The Levels of the Identified tRFs in the Training and Testing Phases
| Training Phase |
Testing Phase |
Combined |
||||||||
|---|---|---|---|---|---|---|---|---|---|---|
| NC | BC | Fc | p Value | NC | BC | Fc | p Value | Fc | p Value | |
| tRF-Glu-CTC-003 | 8.196 ± 1.119 | 9.769 ± 0.782 | 0.277 | 0.001 | 9.036 ± 2.038 | 10.221 ± 2.086 | 0.459 | 0.001 | 0.437 | 0.001 |
| tRF-Gly-CCC-007 | 0.283 ± 1.543 | 1.991 ± 2.496 | 0.406 | 0.004 | 1.581 ± 3.187 | 4.452 ± 2.347 | 0.063 | 0.001 | 0.089 | 0.001 |
| tRF-Gly-CCC-008 | 4.828 ± 3.454 | 7.184 ± 2.685 | 0.141 | 0.012 | 6.557 ± 2.981 | 7.809 ± 2.888 | 0.363 | 0.003 | 0.272 | 0.001 |
| tRF-Leu-CAA-003 | 8.974 ± 1.718 | 10.082 ± 1.524 | 0.392 | 0.039 | 7.179 ± 1.623 | 9.417 ± 1.948 | 0.282 | 0.001 | 0.299 | 0.001 |
| tRF-Ser-TGA-001 | 6.171 ± 1.602 | 7.925 ± 1.646 | 0.214 | 0.002 | 4.728 ± 3.092 | 7.27 ± 1.974 | 0.078 | 0.001 | 0.086 | 0.001 |
| tRF-Ser-TGA-002 | 6.353 ± 1.262 | 8.203 ± 1.496 | 0.273 | 0.001 | 4.753 ± 3.221 | 7.034 ± 1.818 | 0.100 | 0.001 | 0.110 | 0.001 |
Data are presented as means ± SD. ΔCt, relative to the combination of cel-miR-39 and miR-191-5p; Fc, fold change.
Figure 2.

Profiling of Plasma tRFs and tiRNAs
(A–F) Relative expression levels of identified tRFs—tRF-Glu-CTC-003 (A), tRF-Gly-CCC-007 (B), tRF-Gly-CCC-008 (C), tRF-Leu-CAA-003 (D), tRF-Ser-TGA-001 (E), and tRF-Ser-TGA-002 (F)—in plasma samples of 144 patients with EBC and 112 NCs (combining the training and testing phases). The y axis represents the relative expression level (2−ΔΔCt). Horizontal line shows means with SEM. (G) ROC curves of the identified tRFs for discriminating patients with EBC from NCs in the combination of the training and testing phases (144 patients with EBC and 112 NCs). (H). ROC curve of the six-tRF panel in combination of the training and testing phases (144 patients with EBC and 112 NCs).
Diagnostic Values of the Identified tRFs
To evaluate the diagnostic values of the identified tRFs, we generated receiver operating characteristics (ROC) curves and calculated area under ROC the curves (AUCs). The AUCs for the six-tRF panels were 0.953 (95% confidence interval [CI] 0.893–1.000, p < 0.001) and 0.853 (95% CI 0.802–0.904, p < 0.001) in the training and testing phases, respectively (Figures S2A and S2B). Combining the two phases, the AUCs were 0.684 (95% CI 0.619–0.749, p < 0.001), 0.758 (95% CI 0.699–0.817, p < 0.001), 0.630 (95% CI 0.562–0.698, p < 0.001), 0.772 (95% CI 0.715–0.829, p < 0.001), 0.740 (95% CI 0.677–0.803, p < 0.001), and 0.739 (95% CI 0.675–0.804, p < 0.001) for tRF-Glu-CTC-003, tRF-Gly-CCC-007, tRF-Gly-CCC-008, tRF-Leu-CAA-003, tRF-Ser-TGA-001, and tRF-Ser-TGA-002, respectively (Figure 2G). The AUC for the six-tRF panel was 0.844 (95% CI 0.795–0.892, p < 0.001) (Figure 2H), which was better than that of any identified tRFs, with a sensitivity of 87.5% and a specificity of 68.8%. The optimal cutoff value was determined at the highest Youden index (0.492) for these identified tRFs. Then, the six tRFs were used to construct a panel, and a logistic-regression model was predicted by the equation: Logit(P) = −6.445 + 0.036 × tRF-Glu-CTC-003 + 0.222 × tRF-Gly-CCC-007 + 0.056 × tRF-Gly-CCC-008 + 0.391 × tRF-Leu-CAA-003 + 0.353 × tRF-Ser-TGA-001 − 0.041 × tRF-Ser-TGA-002. Furthermore, the AUC of the external validation phase was 0.828 (95% CI 0.713–0.943, p < 0.001) (Figure S2C).
Associations between the Identified tRFs and Clinicopathological Characteristics
As shown in Figure 3A, the expression levels of the six tRFs were consistently less in plasma samples of patients with invasive BC compared with NCs. Moreover, the expression levels of tRF-Gly-CCC-008, tRF-Leu-CAA-003, and tRF-Ser-TGA-002 were less in plasma samples of patients with breast carcinoma in situ than they were in NCs (p = 0.036, 0.029 and 0.040, respectively). The p values of the other tRFs were greater than 0.05, but relatively low. We also found that the six tRFs could distinguish patients with or without lymph node metastasis from NCs, but no statistical difference was found in the comparison of those with metastatic and non-metastatic lymph nodes (Figure 3B). There were also apparent differences among patients with each subtype and NCs, without tRF-Glu-CTC-003 of HER2+ type and tRF-Gly-CCC-008 of luminal type (Figure 3C). The expression levels of all identified tRFs were significantly less in patients with grades I + II or III than they were in NCs (Figure S3).
Figure 3.

Associations between the Identified tRFs and Clinicopathological Characteristics
(A) Associations of the identified tRFs with NCs, breast carcinoma in situ, and invasive carcinoma. (B) Associations of the identified tRFs with the number of lymph nodes. (C) Associations of the identified tRFs with different subtypes. The y axis represents the relative expression level (2−ΔΔCt). Horizontal line shows means with SEM.
Prognostic Values of the Identified tRFs
To analyze disease-free survival (DFS) and overall survival (OS), a log-rank test was performed. According to the expression levels, patients were categorized into high or low expression group. HER2+ patients with a low tRF-Glu-CTC-003 expression level seemed to have a worse DFS (Figure 4A) and OS (Figure 4B) than those with high expression levels. No meaningful results could be found with other tRFs in all samples or HER2+ samples (Figure S4).
Figure 4.

Prognostic Values of the Identified tRFs
High expression levels of tRF-Glu-CTC-003 indicated a trending association with prolonged DFS (A) and OS (B) in patients with HER2+ EBC.
The Expression Levels in Cell Supernatants, Exosomes Isolated from Plasma, and Tissues
The expression levels of the six tRFs were assayed in cell supernatants, and the expression level of each tRF was less in at least five BC cell lines than it was in the human breast epithelial cell line MCF-10A (Figure 5A). Furthermore, we examined the expression levels in exosomes isolated from plasma samples of 24 patients with EBC and 16 NCs. Exosomes were verified by western blotting (Figure S5). tRF-Ser-TGA-001 and tRF-Ser-TGA-002 exhibited significantly lower levels in exosomes from patients with EBC than the levels in NCs (Figure 5B). To investigate any similarity between plasma and tissue samples, we assessed 35 paired tissues. The expression levels of the six tRFs were significantly less in BC tissues than in the adjacent normal tissues (Figure 5C).
Figure 5.

The Expression Levels of the Identified tRFs in Cell Supernatants, Exosomes Isolated from Plasma, and Tissues
(A) The expression levels in cell supernatants. The y axis represents the relative expression level (2−ΔΔCt). Horizontal line shows means with SEM. (B) The expression levels in exosomes isolated from plasma samples of 24 patients with BC and 16 NCs. The y axis represents the relative expression level (2−ΔΔCt). Horizontal line shows means with SEM. (C) The expression levels in tumor tissues and the adjacent normal tissues. The y axis represents the relative expression level (2−ΔΔCt). ∗p < 0.05, ∗∗p < 0.01, ∗∗∗p < 0.001.
Bioinformatics Analysis of the Identified tRFs
The positions of the identified tRFs on the cloverleaf secondary structure of their respective tRNAs are shown in Figure 6A. The structures of tRF-Gly-CCC-007 and tRF-Gly-CCC-008 were similar, as were tRF-Ser-TGA-001 and tRF-Ser-TGA-002. Previous research has strongly suggested that tRFs enter into AGO complexes by pairing with their targets, and that the anatomy of a tRF-Target-Ago complex is similar to that of a microRNA-Target-Ago complex.24, 25, 26, 27 tRFs are surprisingly associated with the AGO family of proteins, specifically AGO1, 3, and 4. We predicted target genes using the TargetScan prediction program (Figure 6B). Gene Ontology (GO) analysis was then performed, including assessment of molecular function, biological processes, and cellular components. Target genes of tRF-Glu-CTC-003 and tRF-Leu-CAA-003, such as AKT1 and MYD88, were primarily intracellular and involved in biosynthetic and catabolic processes. For tRF-Gly-CCC-007 and tRF-Gly-CCC-008, CDC42 was the target gene, mainly found in intracellular organelles; the key molecular function was participation in Ras and Rho GTPase binding, and the main biological process was regulation of GTPase activity. tRF-Ser-TGA-001 and tRF-Ser-TGA-002 were located in structures involved in protein synthesis, affecting the activity of protein transmembrane transporters and took part in the regulation of bicellular tight junction assembly (Figure S6). Kyoto Encyclopedia of Genes and Genomes (KEGG) analysis showed that the signaling pathways of target genes mainly included the AMPK signaling pathway, the TNF signaling pathway, and the FoxO signaling pathway (Figure S7). To explore intrinsic mechanisms, a protein-protein interaction (PPI) network for these genes was established by the STRING database (Figure 6C).
Figure 6.

Bioinformatics Analysis of the Identified tRFs
(A) Position of the identified tRFs in the cloverleaf secondary structure of their respective tRNAs. (B) Target sites of the identified tRFs. (C) Protein-protein interaction (PPI) networks of the target genes.
Discussion
Some studies have reported the effects of circulating tRFs in the diagnosis of epilepsy, clear cell renal cell carcinoma, gastric cancer, and so on.17,18,28 Most studies directly verified the selected tRFs in tissues or blood, whereas we designed a four-phase study to identify tRFs for the diagnosis of EBC. High-throughput sequencing was applied to identify differentially expressed tRFs and tiRNAs. The training phase was conducted to assess the identified tRFs. Then, the testing phase was used to test the selected tRFs in a larger cohort. We also verified reliability and reproducibility in the external validation phase. Interestingly, all identified tRFs belonged to the tRF-5 class.
Similar to miRNAs, tRFs can regulate gene expression by competitively binding to mRNA or translation initiation complex. tRF-5 is produced by cleavage at the D-loop of tRNA or the stem region between the D-loop and anticodon loop. tRF-5 has a 5′ phosphate and is mostly found in the nucleus.26 The cleavage sites of tRF-3 are at the T-loop, and tRF-3 has a 3′ hydroxyl moiety containing a CCA sequence and is mainly cytoplasmic.25 Some researchers believe that both tRF-5 and tRF-3 are associated with RNA silencing, whereas others believe that tRF-5 can inhibit the process of protein translation and is regarded as a new mechanism of gene regulation.29,30 The mechanism underlying the roles of tRF-5 and tRF-3 needs to be further studied.
The associations between the expression levels and the number of involved lymph nodes were analyzed. There were significant differences between patients with or without lymph node metastasis and NCs, but there was no statistical difference between patients with metastatic and non-metastatic lymph nodes. According to Fisher’s theory, BC is a systemic disease in its early stage. It has been reported that one or more CTCs can be detected in 25.2% of EBC cases.31 The number of CTCs is closely related to tumor size, and CTCs can act as an independent prognostic factor. As rare cells, the use of CTCs for the diagnosis of EBC has the problem of low sensitivity. tRFs, as novel plasma markers, show high diagnostic efficacy for early-stage disease, particularly for early-stage disease without lymph node metastasis.
The expression levels of the six tRFs were notably less in patients with invasive carcinoma. In addition, these tRFs appeared to have unique characteristics in the diagnosis of breast carcinoma in situ. The expression levels of tRF-Gly-CCC-008, tRF-Leu-CAA-003, and tRF-Ser-TGA-002 were notably less in patients with breast carcinoma in situ than they were in NCs, and tRF-Glu-CTC-003, tRF-Gly-CCC-007 and tRF-Ser-TGA-001 slightly missed the margin of significances. Breast carcinoma in situ, some cases of which present without a mass, poses a higher requirement for diagnosis. Because tumor cells do not break through the basement membrane, diagnosis via CTCs is theoretically ineffective. Some studies have focused on proteomic changes in serum samples of patients with ductal carcinoma in situ to make early diagnoses.32,33 Surprisingly, we found that the selected tRFs have great significance in the diagnosis of carcinoma in situ. However, because of the limited samples and unclear molecular mechanism, these tRFs can only provide new ideas for the diagnosis of carcinoma in situ and need to be verified in a larger sample size.
Although the expression levels of the six tRFs in all patients with EBC were significantly less than those in NCs, tRF-Glu-CTC-003 showed no difference between NCs and patients with HER2+ disease, and tRF-Gly-CCC-008 showed no difference between NCs and patients with luminal-type disease. These results suggested that tRF-Glu-CTC-003 and tRF-Gly-CCC-008 may result in increased false-negative rates in certain subtypes. In contrast, tRF-Glu-CTC-003 and tRF-Gly-CCC-008 were significantly less in triple-negative BC (TNBC) than it was in other subtypes, suggesting that tRF-Glu-CTC-003 and tRF-Gly-CCC-008 may have specific mechanisms in TNBC.
With standard treatment, the rates of metastasis and recurrence were significantly reduced, and OS was prolonged. Although the follow-up time in this study was limited, we found some significant differences. The lower expression level of tRF-Glu-CTC-003 was related to worse DFS and OS among patients with HER2+ disease. These results suggested that tRFs could be used as an evaluation index for the prognosis of EBC.
To obtain more information about the six tRFs, we analyzed the expression levels of the identified tRFs in cell supernatants. The general subtypes of these cell lines include luminal, TNBC, and HER2+. As expected, the six tRFs were significantly downregulated in at least five cell lines, compared with their expression levels in normal human breast epithelial cell line MCF-10A, but there was no discernible difference among different subtypes. These results were consistent with differences in plasma samples between different subtypes and NCs. Exosomes are small membranous vesicles containing RNA and protein secreted by many cells under normal or pathological conditions and can be detected in various body fluids. Recent studies have shown that plasma exosomal tRFs could be used to detect osteoporosis.34 We also evaluated the expression levels of tRFs in exosomes isolated from plasma; the expression levels of tRF-Ser-TGA-001 and tRF-Ser-TGA-002 were less in exosomes from patients with EBC than they were in NCs. Therefore, we speculated that exosomes may be involved in the development of BC. These tRFs were also studied in tissues. Intriguingly, the expression levels of the six tRFs were less in BC tissues than they were in adjacent normal tissues, which suggested that these tRFs may be inhibitors of BC.
Based on the bioinformatics analysis, we investigated target genes of tRF-Glu-CTC-003 and selected the proteins they most frequently interacted with, such as AKT1. AKT1 is one of three closely related serine/threonine-protein kinases (AKT1, AKT2, and AKT3) and regulates many processes. Gao et al.35 found that deletion of AKT1 stimulated the β-catenin pathway to promote prostate cancer metastasis. Target genes of tRF-Gly-CCC-007 and tRF-Gly-CCC-008 were also analyzed, and the results showed that the affected proteins were mainly GTPases, such as CDC42, a small GTPase linked to different cancers and related to epithelial to mesenchymal transition, migration, invasion, and angiogenesis.36, 37, 38, 39 The target genes of tRF-Leu-CAA-003 were mainly concerned with catabolic processes. MYD88, a toll-like receptor signaling adaptor protein, is critical in the development of pancreatic cancer, epithelial ovarian cancer, and bladder cancer.40, 41, 42 Finally, the roles of these tRFs in the development of BC were further confirmed by analyzing their target genes, and they were considered to serve as potential biomarkers for the detection of EBC.
In conclusion, our study identified six tRFs from the 5′ ends of tRNAs (tRF-Glu-CTC-003, tRF-Gly-CCC-007, tRF-Gly-CCC-008, tRF-Leu-CAA-003, tRF-Ser-TGA-001, and tRF-Ser-TGA-002) as promising, novel biomarkers for the diagnosis of EBC, providing additional evidence for, and a better understanding of, the effects of tRFs in the development of EBC.
Materials and Methods
Collection of Samples
All samples (blood and tissues) were collected at the First Affiliated Hospital with Nanjing Medical University between January and December 2015, except for 48 blood samples in the external validation phase (24 patients with EBC and 24 NCs), which are collected at Nanjing First Hospital. The study got the approval of the institutional ethical committee of the First Affiliated Hospital with Nanjing Medical University and written, informed consent from all participants. A total of 316 females were enrolled in our study, including 176 patients with BC without any neoadjuvant therapy and 140 NCs who underwent routine physical examination. All participants were selected randomly. In addition, 35 paired formalin-fixed, paraffin-embedded sections of BC tissues and adjacent normal tissues were randomly selected from the 176 patients with BC. Two-milliliter blood samples were collected from each participant. Plasma samples were separated from blood within 4 h after collection and then stored at −80°C for further analysis. Tissues were stored in liquid nitrogen.
Classification of Subtypes
According to the status of estrogen receptor (ER), progesterone receptor (PR), and HER2, assessed by immunohistochemistry or fluorescence in situ hybridization based on the guidelines,43,44 BC mainly includes hormone-receptor-positive (ER+ and/or PR+, including luminal A and luminal B), HER2+ (ER−, PR−, and HER2 amplified), and TNBC (ER−, PR−, and HER2−) disease.
Collection of Cell Supernatants
Human breast epithelial cell line MCF-10A and human BC cell lines (ZR-75-1, T47D, MCF-7, SUM-1315, MDA-MB-231, HCC1806, BT474, SK-BR-3, and MDA-MB-453) were used in this study. All cells, except SUM-1315, were obtained from the America Type Culture Center (Manassas, VA, USA). The SUM-1315 cell line was provided by Stephen Ethier at University of Michigan. All cells were cultured in Dulbecco’s Modified Eagle Medium (Gbico, Suzhou, China) with 10% fetal bovine serum and 1% penicillin-streptomycin and were maintained at 37°C with 5% CO2. Cells were seeded at a density of 106 cells in 100- × 20-mm cell culture dishes. Cell supernatants were collected after 24 h, and 200 μL of supernatant was collected after centrifugation and stored at −80°C for further analysis.
Isolation of Exosomes
Exosomes were isolated from plasma samples with Exo-Quick Exosome Precipitation Solution (System Biosciences, Palo Alto, CA, USA) according to the manufacturer’s instructions. First, 200 μL of plasma was pretreated with 2 μL of thrombin and then mixed with 50 μL of ExoQuick Exosome Precipitation Solution. After the supernatants were discarded, the exosome pellets were lysed in 200 μL of RNase-free water for further RNA extraction.
RNA Extraction
Total RNAs from plasma, cell supernatants, and exosomes were isolated with the mirVana PARIS Kit (Thermo Fisher Scientific Baltics, Vilnius, Lithuania) according to the manufacturer’s protocol. Each sample was mixed with 5 μL of synthetic Caenorhabditis elegans miRNA (cel-miR-39, 5 nM/L; RiboBio, Guangzhou, China) to normalize differences before extraction. Total RNAs from tissues were extracted with RNAiso plus (Takara Bio, Kusatsu, Japan) according to the manufacturer’s protocol. Total RNAs were eluted with RNase-free water. RNA concentration and purity were measured with a Nanodrop 2000 spectrophotometer (NanoDrop Technologies, Wilmington, DE, USA). The ratios of the optical density for all samples were between 1.8 and 2.0. All samples were stored at −80°C for further analysis.
qRT-PCR Assay
Each RNA was reverse transcribed to cDNA using the Bulge-Loop MicroRNA qRT-PCR Primer Sets (Ribobio, Guangzhou, China), specially designed for tRFs. The bulge-loop reverse transcription primers were 40–60 nt and included stem 1, bulge, stem 2, ring, stem 3, and an extension from the 5′ end to 3′ end. Stem 3 was complementary with stem 1 and stem 2, and the extension was complementary with small RNA. The method could specifically amplify identical sequences without detecting precursors that contained identical sequences. The reverse transcription reaction assays were performed at 70°C for 10 min, followed by 42°C for 60 min and 70°C for 10 min.
The qRT-PCR assay was run on the Roche LightCycler® 480 System (Roche, Basel, Switzerland) in 384-well plates at 95°C for 20 s, followed by 40 cycles at 95°C for 10 s, 60°C for 20 s, and 70°C for 10 s. The PCR forward primers were 20–40 nt, with extensions and sequences similar to small RNAs. The similarity is part of the complementary sequence of the cDNA. General reverse primers were 20–40 nt. All samples were run in triplicate. The expression levels of each tRF in plasma, cell supernatants, and exosomes were relatively quantified to the expression level of the combination of cel-miR-39 (exogenous reference) and miR-191-5p (endogenous reference) (ΔCt = CttRF − 0.5 × [Ctcel-miR-39 + CtmiR-191-5p]). U6 was used as an internal control for tissues. The expression level of each tRF in different samples was assessed via the 2−ΔΔCt method. The relative expression level of each sample was divided by the mean of the expression levels of the NCs.
To ensure the accuracy of primers, synthetic standard RNAs were used, which were identical to the target sequence. Melting curve and melting temperature for each primer in the standard RNA and the RNA isolated from plasma were examined, and they were consistent (Figure S8A). Moreover, the specificity of the primers was also determined by agarose gel electrophoresis (AGE) (Figure S8B).
Agarose Gel Electrophoresis
The qRT-PCR amplified products were detected by AGE and observed by staining with Goldview (YBscience, Shanghai, China). AGE was performed with 3% agarose gels (Biowest, Nuaillé, France) in Tris-borate-EDTA (TBE) buffer (Beyotime, Shanghai, China). Each qRT-PCR product was mixed with 10× loading buffer (Takara), and all samples were run by electrophoresis (100 V, 30 min). DL500 DNA Marker (Takara) was used as a marker.
Gene Ontology and Pathway Analyses
The position of each tRF in the secondary structure of derived tRNA was based on GtRNAdb (http://gtrnadb.ucsc.edu/), and target genes were predicted by TargetScan (http://www.targetscan.org/vert_72/). GO and pathway analyses were performed to explore potential functions of the identified tRFs. Pathway analysis was used to describe the pathways of the identified target genes based on the KEGG. The STRING database was used to clarify PPIs among these genes.
Statistical Analysis
GeNorm (version 3.5) was used to assess the stability of endogenous references and to calculate the stability value (M). A high M value implies low stability and high variation, whereas a low M value implies high stability and low variation. The Mann-Whitney U test was used to compare the expression levels of tRFs between patients with EBC and NCs. ROC curves and the AUCs were used to evaluate the values of the identified tRFs. Logistic-regression analysis was used to establish the tRF panel. The associations between the identified tRFs and clinical characteristics were evaluated via one-way analysis of variance. Least significance difference (LSD) was used to adjust p values. Each tRF was compared between EBC tissues and adjacent normal tissues by paired t tests. All statistical analyses were performed with SPSS software (version 25.0, SPSS, Chicago, IL, USA), and all graphs were plotted with GraphPad Prism software (version 8.0, GraphPad Software, La Jolla, CA, USA). Analysis items with p < 0.05 were considered statistically significant.
Author Contributions
T.X., X.L., and S.W. were responsible for the study design, the revision of the article, and final approval of the version to be submitted. J.W., G.M., and M. Li performed the experimental study and the statistical analysis and drafted and revised the article. X.H., J.X., M. Liang, X.M., and X.C. performed sample collection and clinical evaluations. All authors read and approved the final version of the manuscript.
Conflicts of Interest
The authors declare no competing interests.
Acknowledgments
We thank Dr. Stephen Ethier for providing breast cancer cells and the patients for participating in this study. This study was funded by the Natural Science Foundation of China (81572607 and 81572602); the Natural Science Foundation of Jiangsu Province (BK20171506); Postgraduate Research & Practice Innovation Program of Jiangsu Province (KYCX19_1158); and Projects of reinvigorating medcine through science and education, Jiangsu Health and Family Planning Commission (QNRC2016-208).
Footnotes
Supplemental Information can be found online at https://doi.org/10.1016/j.omtn.2020.07.026.
Contributor Information
Tiansong Xia, Email: xiatsswms@163.com.
Xiaoan Liu, Email: liuxiaoan@126.com.
Shui Wang, Email: ws0801@hotmail.com.
Supplemental Information
References
- 1.Siegel R.L., Miller K.D., Jemal A. Cancer statistics, 2019. CA Cancer J. Clin. 2019;69:7–34. doi: 10.3322/caac.21551. [DOI] [PubMed] [Google Scholar]
- 2.Smith R.A., Andrews K.S., Brooks D., Fedewa S.A., Manassaram-Baptiste D., Saslow D., Brawley O.W., Wender R.C. Cancer screening in the United States, 2018: a review of current American Cancer Society guidelines and current issues in cancer screening. CA Cancer J. Clin. 2018;68:297–316. doi: 10.3322/caac.21446. [DOI] [PubMed] [Google Scholar]
- 3.Oeffinger K.C., Fontham E.T., Etzioni R., Herzig A., Michaelson J.S., Shih Y.C., Walter L.C., Church T.R., Flowers C.R., LaMonte S.J., American Cancer Society Breast cancer screening for women at average risk: 2015 guideline update from the American Cancer Society. JAMA. 2015;314:1599–1614. doi: 10.1001/jama.2015.12783. [DOI] [PMC free article] [PubMed] [Google Scholar]
- 4.Kolb T.M., Lichy J., Newhouse J.H. Comparison of the performance of screening mammography, physical examination, and breast US and evaluation of factors that influence them: an analysis of 27,825 patient evaluations. Radiology. 2002;225:165–175. doi: 10.1148/radiol.2251011667. [DOI] [PubMed] [Google Scholar]
- 5.Miller K.D., Nogueira L., Mariotto A.B., Rowland J.H., Yabroff K.R., Alfano C.M., Jemal A., Kramer J.L., Siegel R.L. Cancer treatment and survivorship statistics, 2019. CA Cancer J. Clin. 2019;69:363–385. doi: 10.3322/caac.21565. [DOI] [PubMed] [Google Scholar]
- 6.Kaiser J. ‘Liquid biopsy’ for cancer promises early detection. Science. 2018;359:259. doi: 10.1126/science.359.6373.259. [DOI] [PubMed] [Google Scholar]
- 7.Plaks V., Koopman C.D., Werb Z. Cancer. Circulating tumor cells. Science. 2013;341:1186–1188. doi: 10.1126/science.1235226. [DOI] [PMC free article] [PubMed] [Google Scholar]
- 8.Das S., Ansel K.M., Bitzer M., Breakefield X.O., Charest A., Galas D.J., Gerstein M.B., Gupta M., Milosavljevic A., McManus M.T., Extracellular RNA Communication Consortium The Extracellular RNA Communication Consortium: establishing foundational knowledge and technologies for extracellular RNA research. Cell. 2019;177:231–242. doi: 10.1016/j.cell.2019.03.023. [DOI] [PMC free article] [PubMed] [Google Scholar]
- 9.Wan J.C.M., Massie C., Garcia-Corbacho J., Mouliere F., Brenton J.D., Caldas C., Pacey S., Baird R., Rosenfeld N. Liquid biopsies come of age: towards implementation of circulating tumour DNA. Nat. Rev. Cancer. 2017;17:223–238. doi: 10.1038/nrc.2017.7. [DOI] [PubMed] [Google Scholar]
- 10.Xu R., Rai A., Chen M., Suwakulsiri W., Greening D.W., Simpson R.J. Extracellular vesicles in cancer—implications for future improvements in cancer care. Nat. Rev. Clin. Oncol. 2018;15:617–638. doi: 10.1038/s41571-018-0036-9. [DOI] [PubMed] [Google Scholar]
- 11.Matamala N., Vargas M.T., González-Cámpora R., Miñambres R., Arias J.I., Menéndez P., Andrés-León E., Gómez-López G., Yanowsky K., Calvete-Candenas J. Tumor microRNA expression profiling identifies circulating microRNAs for early breast cancer detection. Clin. Chem. 2015;61:1098–1106. doi: 10.1373/clinchem.2015.238691. [DOI] [PubMed] [Google Scholar]
- 12.Cuk K., Zucknick M., Heil J., Madhavan D., Schott S., Turchinovich A., Arlt D., Rath M., Sohn C., Benner A. Circulating microRNAs in plasma as early detection markers for breast cancer. Int. J. Cancer. 2013;132:1602–1612. doi: 10.1002/ijc.27799. [DOI] [PubMed] [Google Scholar]
- 13.Heneghan H.M., Miller N., Lowery A.J., Sweeney K.J., Newell J., Kerin M.J. Circulating microRNAs as novel minimally invasive biomarkers for breast cancer. Ann. Surg. 2010;251:499–505. doi: 10.1097/SLA.0b013e3181cc939f. [DOI] [PubMed] [Google Scholar]
- 14.Zhong F., Hu Z., Jiang K., Lei B., Wu Z., Yuan G., Luo H., Dong C., Tang B., Zheng C. Complement C3 activation regulates the production of tRNA-derived fragments Gly-tRFs and promotes alcohol-induced liver injury and steatosis. Cell Res. 2019;29:548–561. doi: 10.1038/s41422-019-0175-2. [DOI] [PMC free article] [PubMed] [Google Scholar]
- 15.Green J.A., Ansari M.Y., Ball H.C., Haqqi T.M. tRNA-derived fragments (tRFs) regulate post-transcriptional gene expression via AGO-dependent mechanism in IL-1β stimulated chondrocytes. Osteoarthritis Cartilage. 2020;28:1102–1110. doi: 10.1016/j.joca.2020.04.014. [DOI] [PMC free article] [PubMed] [Google Scholar]
- 16.Veneziano D., Tomasello L., Balatti V., Palamarchuk A., Rassenti L.Z., Kipps T.J., Pekarsky Y., Croce C.M. Dysregulation of different classes of tRNA fragments in chronic lymphocytic leukemia. Proc. Natl. Acad. Sci. USA. 2019;116:24252–24258. doi: 10.1073/pnas.1913695116. [DOI] [PMC free article] [PubMed] [Google Scholar]
- 17.Hogg M.C., Raoof R., El Naggar H., Monsefi N., Delanty N., O’Brien D.F., Bauer S., Rosenow F., Henshall D.C., Prehn J.H. Elevation in plasma tRNA fragments precede seizures in human epilepsy. J. Clin. Invest. 2019;129:2946–2951. doi: 10.1172/JCI126346. [DOI] [PMC free article] [PubMed] [Google Scholar]
- 18.Zhao C., Tolkach Y., Schmidt D., Kristiansen G., Müller S.C., Ellinger J. 5′-tRNA halves are dysregulated in clear cell renal cell carcinoma. J. Urol. 2018;199:378–383. doi: 10.1016/j.juro.2017.07.082. [DOI] [PubMed] [Google Scholar]
- 19.Feng W., Li Y., Chu J., Li J., Zhang Y., Ding X., Fu Z., Li W., Huang X., Yin Y. Identification of tRNA-derived small noncoding RNAs as potential biomarkers for prediction of recurrence in triple-negative breast cancer. Cancer Med. 2018;7:5130–5144. doi: 10.1002/cam4.1761. [DOI] [PMC free article] [PubMed] [Google Scholar]
- 20.Mitchell P.S., Parkin R.K., Kroh E.M., Fritz B.R., Wyman S.K., Pogosova-Agadjanyan E.L., Peterson A., Noteboom J., O’Briant K.C., Allen A. Circulating microRNAs as stable blood-based markers for cancer detection. Proc. Natl. Acad. Sci. USA. 2008;105:10513–10518. doi: 10.1073/pnas.0804549105. [DOI] [PMC free article] [PubMed] [Google Scholar]
- 21.Mishra S., Srivastava A.K., Suman S., Kumar V., Shukla Y. Circulating miRNAs revealed as surrogate molecular signatures for the early detection of breast cancer. Cancer Lett. 2015;369:67–75. doi: 10.1016/j.canlet.2015.07.045. [DOI] [PubMed] [Google Scholar]
- 22.Rinnerthaler G., Hackl H., Gampenrieder S.P., Hamacher F., Hufnagl C., Hauser-Kronberger C., Zehentmayr F., Fastner G., Sedlmayer F., Mlineritsch B., Greil R. miR-16-5p is a stably-expressed housekeeping microRNA in breast cancer tissues from primary tumors and from metastatic sites. Int. J. Mol. Sci. 2016;17:156. doi: 10.3390/ijms17020156. [DOI] [PMC free article] [PubMed] [Google Scholar]
- 23.Hu J., Wang Z., Liao B.Y., Yu L., Gao X., Lu S., Wang S., Dai Z., Zhang X., Chen Q. Human miR-1228 as a stable endogenous control for the quantification of circulating microRNAs in cancer patients. Int. J. Cancer. 2014;135:1187–1194. doi: 10.1002/ijc.28757. [DOI] [PubMed] [Google Scholar]
- 24.Hafner M., Landthaler M., Burger L., Khorshid M., Hausser J., Berninger P., Rothballer A., Ascano M., Jr., Jungkamp A.C., Munschauer M. Transcriptome-wide identification of RNA-binding protein and microRNA target sites by PAR-CLIP. Cell. 2010;141:129–141. doi: 10.1016/j.cell.2010.03.009. [DOI] [PMC free article] [PubMed] [Google Scholar]
- 25.Kumar P., Anaya J., Mudunuri S.B., Dutta A. Meta-analysis of tRNA derived RNA fragments reveals that they are evolutionarily conserved and associate with AGO proteins to recognize specific RNA targets. BMC Biol. 2014;12:78. doi: 10.1186/s12915-014-0078-0. [DOI] [PMC free article] [PubMed] [Google Scholar]
- 26.Kumar P., Kuscu C., Dutta A. Biogenesis and function of transfer rna-related fragments (tRFs) Trends Biochem. Sci. 2016;41:679–689. doi: 10.1016/j.tibs.2016.05.004. [DOI] [PMC free article] [PubMed] [Google Scholar]
- 27.Kuscu C., Kumar P., Kiran M., Su Z., Malik A., Dutta A. tRNA fragments (tRFs) guide Ago to regulate gene expression post-transcriptionally in a Dicer-independent manner. RNA. 2018;24:1093–1105. doi: 10.1261/rna.066126.118. [DOI] [PMC free article] [PubMed] [Google Scholar]
- 28.Zhu L., Li T., Shen Y., Yu X., Xiao B., Guo J. Using tRNA halves as novel biomarkers for the diagnosis of gastric cancer. Cancer Biomark. 2019;25:169–176. doi: 10.3233/CBM-182184. [DOI] [PubMed] [Google Scholar]
- 29.Burroughs A.M., Ando Y., de Hoon M.J., Tomaru Y., Suzuki H., Hayashizaki Y., Daub C.O. Deep-sequencing of human Argonaute-associated small RNAs provides insight into miRNA sorting and reveals Argonaute association with RNA fragments of diverse origin. RNA Biol. 2011;8:158–177. doi: 10.4161/rna.8.1.14300. [DOI] [PMC free article] [PubMed] [Google Scholar]
- 30.Sobala A., Hutvagner G. Small RNAs derived from the 5′ end of tRNA can inhibit protein translation in human cells. RNA Biol. 2013;10:553–563. doi: 10.4161/rna.24285. [DOI] [PMC free article] [PubMed] [Google Scholar]
- 31.Bidard F.C., Michiels S., Riethdorf S., Mueller V., Esserman L.J., Lucci A., Naume B., Horiguchi J., Gisbert-Criado R., Sleijfer S. Circulating Tumor Cells in Breast Cancer Patients Treated by Neoadjuvant Chemotherapy: A Meta-analysis. J. Natl. Cancer Inst. 2018;110:560–567. doi: 10.1093/jnci/djy018. [DOI] [PubMed] [Google Scholar]
- 32.Desmetz C., Bascoul-Mollevi C., Rochaix P., Lamy P.J., Kramar A., Rouanet P., Maudelonde T., Mangé A., Solassol J. Identification of a new panel of serum autoantibodies associated with the presence of in situ carcinoma of the breast in younger women. Clin. Cancer Res. 2009;15:4733–4741. doi: 10.1158/1078-0432.CCR-08-3307. [DOI] [PubMed] [Google Scholar]
- 33.Solassol J., Rouanet P., Lamy P.J., Allal C., Favre G., Maudelonde T., Mangé A. Serum protein signature may improve detection of ductal carcinoma in situ of the breast. Oncogene. 2010;29:550–560. doi: 10.1038/onc.2009.341. [DOI] [PubMed] [Google Scholar]
- 34.Zhang Y., Cai F., Liu J., Chang H., Liu L., Yang A., Liu X. Transfer RNA-derived fragments as potential exosome tRNA-derived fragment biomarkers for osteoporosis. Int. J. Rheum. Dis. 2018;21:1659–1669. doi: 10.1111/1756-185X.13346. [DOI] [PubMed] [Google Scholar]
- 35.Gao F., Alwhaibi A., Artham S., Verma A., Somanath P.R. Endothelial Akt1 loss promotes prostate cancer metastasis via β-catenin-regulated tight-junction protein turnover. Br. J. Cancer. 2018;118:1464–1475. doi: 10.1038/s41416-018-0110-1. [DOI] [PMC free article] [PubMed] [Google Scholar]
- 36.Maldonado M.D.M., Dharmawardhane S. Targeting Rac and Cdc42 GTPases in cancer. Cancer Res. 2018;78:3101–3111. doi: 10.1158/0008-5472.CAN-18-0619. [DOI] [PMC free article] [PubMed] [Google Scholar]
- 37.Humphries-Bickley T., Castillo-Pichardo L., Hernandez-O’Farrill E., Borrero-Garcia L.D., Forestier-Roman I., Gerena Y., Blanco M., Rivera-Robles M.J., Rodriguez-Medina J.R., Cubano L.A. Characterization of a dual Rac/Cdc42 inhibitor MBQ-167 in metastatic cancer. Mol. Cancer Ther. 2017;16:805–818. doi: 10.1158/1535-7163.MCT-16-0442. [DOI] [PMC free article] [PubMed] [Google Scholar]
- 38.Zhu G.F., Xu Y.W., Li J., Niu H.L., Ma W.X., Xu J., Zhou P.R., Liu X., Ye D.L., Liu X.R. Mir20a/106a-WTX axis regulates RhoGDIa/CDC42 signaling and colon cancer progression. Nat. Commun. 2019;10:112. doi: 10.1038/s41467-018-07998-x. [DOI] [PMC free article] [PubMed] [Google Scholar] [Retracted]
- 39.Guo Y., Kenney S.R., Muller C.Y., Adams S., Rutledge T., Romero E., Murray-Krezan C., Prekeris R., Sklar L.A., Hudson L.G., Wandinger-Ness A. R-Ketorolac targets Cdc42 and Rac1 and alters ovarian cancer cell behaviors critical for invasion and metastasis. Mol. Cancer Ther. 2015;14:2215–2227. doi: 10.1158/1535-7163.MCT-15-0419. [DOI] [PMC free article] [PubMed] [Google Scholar]
- 40.Zhu X., Burfeind K.G., Michaelis K.A., Braun T.P., Olson B., Pelz K.R., Morgan T.K., Marks D.L. MyD88 signalling is critical in the development of pancreatic cancer cachexia. J. Cachexia Sarcopenia Muscle. 2019;10:378–390. doi: 10.1002/jcsm.12377. [DOI] [PMC free article] [PubMed] [Google Scholar]
- 41.Block M.S., Vierkant R.A., Rambau P.F., Winham S.J., Wagner P., Traficante N., Tołoczko A., Tiezzi D.G., Taran F.A., Sinn P., Australian Ovarian Cancer Study Group MyD88 and TLR4 expression in epithelial ovarian cancer. Mayo Clin. Proc. 2018;93:307–320. doi: 10.1016/j.mayocp.2017.10.023. [DOI] [PMC free article] [PubMed] [Google Scholar]
- 42.Sun M., Zhao W., Chen Z., Li M., Li S., Wu B., Bu R. Circular RNA CEP128 promotes bladder cancer progression by regulating Mir-145-5p/Myd88 via MAPK signaling pathway. Int. J. Cancer. 2019;145:2170–2181. doi: 10.1002/ijc.32311. [DOI] [PubMed] [Google Scholar]
- 43.Gradishar W.J., Anderson B.O., Blair S.L., Burstein H.J., Cyr A., Elias A.D., Farrar W.B., Forero A., Giordano S.H., Goldstein L.J., National Comprehensive Cancer Network Breast Cancer Panel Breast cancer version 3.2014. J. Natl. Compr. Canc. Netw. 2014;12:542–590. doi: 10.6004/jnccn.2014.0058. [DOI] [PubMed] [Google Scholar]
- 44.Wolff A.C., Hammond M.E., Hicks D.G., Dowsett M., McShane L.M., Allison K.H., Allred D.C., Bartlett J.M., Bilous M., Fitzgibbons P., American Society of Clinical Oncology. College of American Pathologists Recommendations for human epidermal growth factor receptor 2 testing in breast cancer: American Society of Clinical Oncology/College of American Pathologists clinical practice guideline update. J. Clin. Oncol. 2013;31:3997–4013. doi: 10.1200/JCO.2013.50.9984. [DOI] [PubMed] [Google Scholar]
Associated Data
This section collects any data citations, data availability statements, or supplementary materials included in this article.