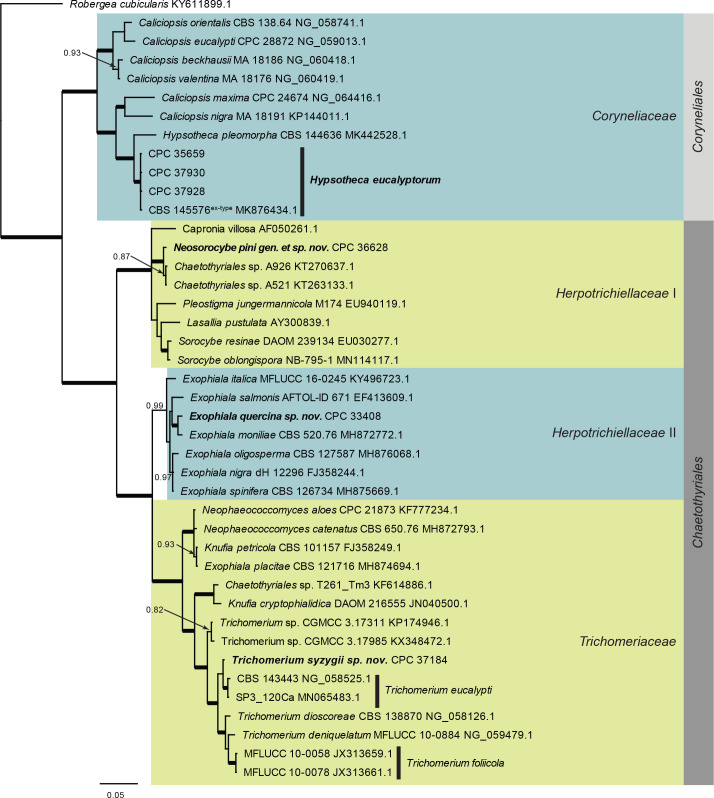
Fig. 4.
Consensus phylogram (50 % majority rule) resulting from a Bayesian analysis of the Eurotiomycetes LSU sequence alignment. Bayesian posterior probabilities (PP) > 0.79 are shown at the nodes and the scale bar represents the expected changes per site. Thickened branches represent PP = 1. Families and orders are indicated with coloured blocks to the right of the tree. GenBank accession and/or culture collection numbers are indicated for all species. The tree was rooted to Robergea cubicularis (voucher G.M. 2013-05-09.1, GenBank KY611899.1) and the species treated in this study for which LSU sequence data were available are indicated in bold face.

