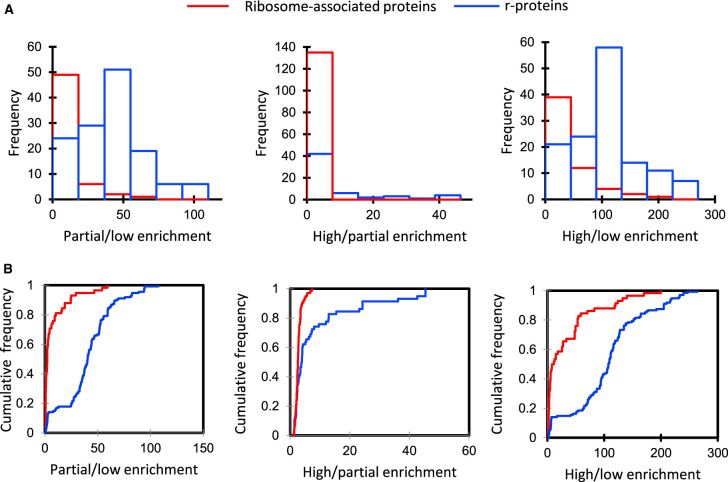
Figure 2. Frequency distribution graphs of the ratio of spectral counts for r-proteins and ribosome-associated proteins in pairs of ribosomal enrichments.
(A) Frequency histogram of the ratio of spectral counts in samples of different enrichment for r-proteins and ribosome-associated proteins; the blue bars indicate the distribution of ratios for r-proteins and red bars indicate the distribution of rations for ribosome-associated proteins. (B) Cumulative relative frequency distribution graphs of (A). Statistical significance was estimated by the Kolmogorov–Smirnov test for 193 proteins including 135 r-proteins (blue) and 58 ribosome-associated proteins (red) (P < 0.0001) from cluster 6 (Figure 1E).

