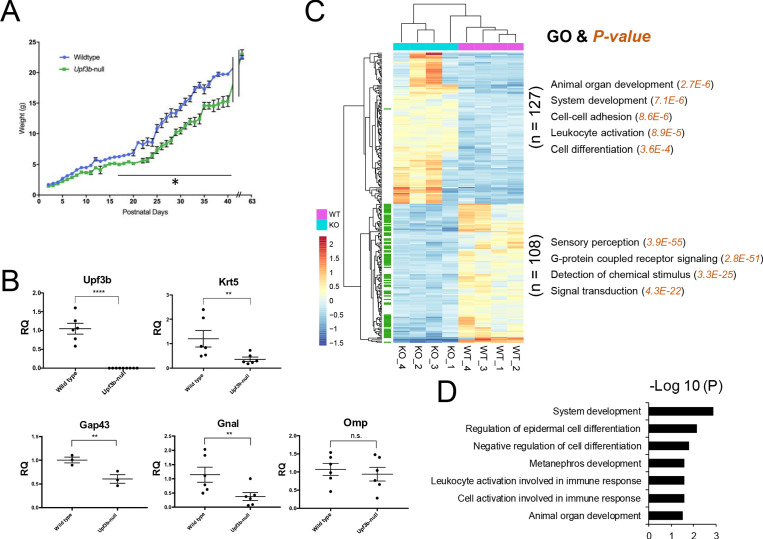
Figure 1. Identification of UPF3B-regulated genes and NMD target genes in the olfactory system.
(A) The weight of Upf3b-null vs. WT (wild type) mice at the indicated time points. Upf3b-null mice gain weight slowly during postnatal development but then reach the weight of WT mice at the last time point (9 weeks), a pattern indicative of a partial olfactory defect. *, p<0.05. (B) qPCR analysis of olfactory marker genes in Upf3b-null and WT OE (n = 6). **, p<0.01; ****, p<0.0001. (C) Heatmap of genes differentially expressed in mOSNs from Upf3b-null (KO) vs. WT mice (four biological replicates from each are shown). Row names labeled as green are Olfr genes. Right, the most statistically significant GO terms associated with upregulated genes (top) and downregulated genes (bottom) after Upf3b loss. (D) A list of most statistically enriched GO terms associated with the 52 high-confidence UPF3B-dependent NMD target mRNAs we identified in mOSNs.


