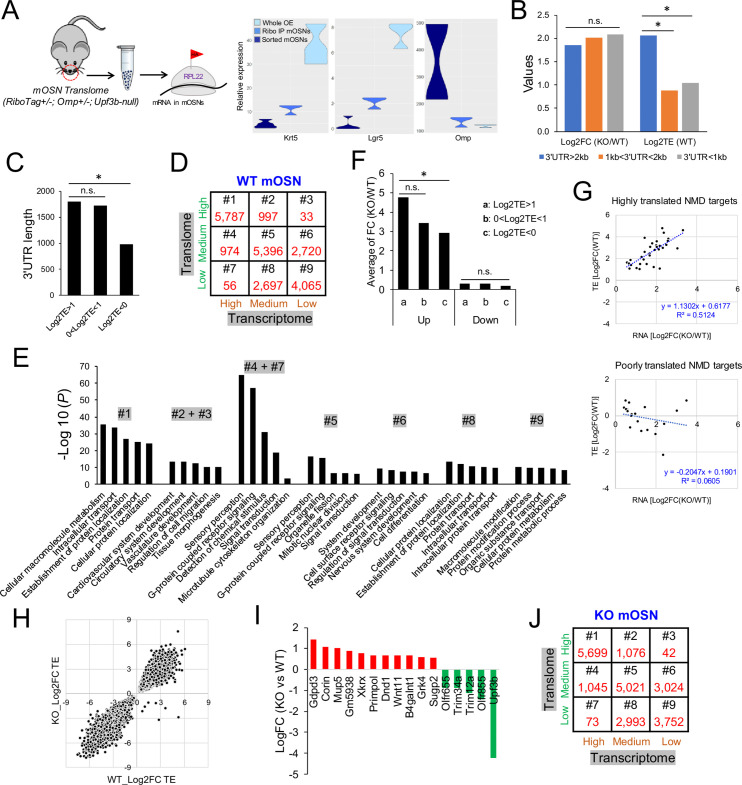
Figure 2. The mOSN translome and NMD.
(A) Left, strategy used to define the mOSN translome. Right, RNAseq analysis of the expression of gene markers for HBCs (Krt5), GBCs (Lgr5), and mOSNs (Omp) in the indicated samples. (B) Average inferred translation efficiency (TE) of mOSN mRNAs with the indicated 3’UTR length ranges. *, p<0.05. (C) Average 3’UTR length of mOSN mRNAs with the indicated range of TE values. *, p<0.05. (D) mOSN mRNAs from WT mice stratified by steady-state mRNA level (transcriptome) and TE. The number of genes in each category is indicated. (E) Top enriched GO terms associated with the different categories of genes defined in (D). (F) Analysis of upregulated mRNAs (candidate NMD targets) and downregulated mRNAs (indirect targets) are shown on the left and right, respectively. The average shift in expression in Upf3b-null mOSNs relative to WT mOSNs is shown for mOSNs binned by TE (a and c have the highest and lowest TE values, respectively). *, p<0.05. (G) Scatter plot of the 52 high-confidence mOSN NMD targets, showing TE vs. NMD magnitude (upregulation in Upf3b-null mOSNs). Both values are log2-transformed. (H) Scatterplot showing the TE of mRNAs in Upf3b-null vs. WT mOSNs. (I) mRNAs exhibiting significantly altered TE in response to Upf3b loss. (J) mOSN mRNAs from Upf3b-null (KO) mice stratified by steady-state mRNA level (transcriptome) and TE. The number of cells in each category is indicated.

