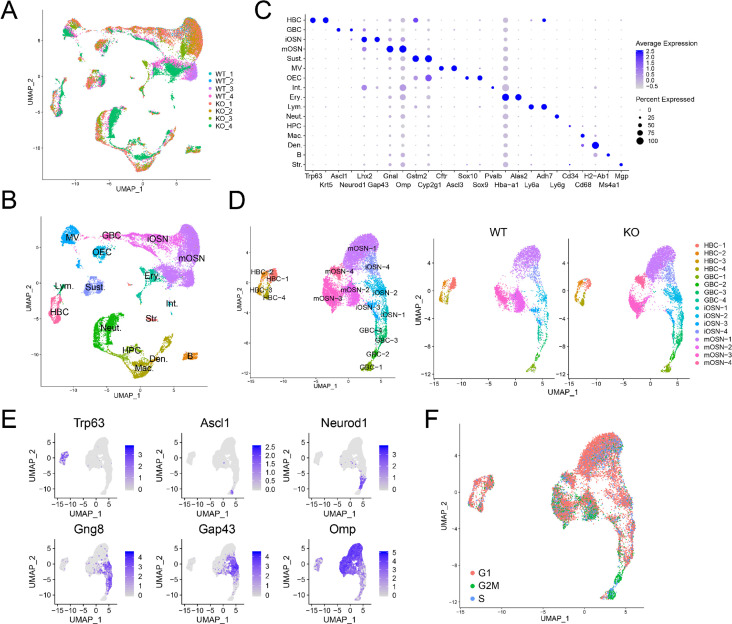
Figure 3. Identification of OE cell subsets using scRNAseq analysis.
(A) UMAP plot of OE cells from 4 Upf3b-null (KO) and 4 WT mice analyzed by scRNAseq. (B) Same UMAP plot as is in (A), showing the identity of the different cell clusters. (C) Dotplot depicting the expression of gene markers in the cell clusters defined in (B). (D) Left, UMAP plot of reclustered OSN precursors/OSNs defined in (A). Right, genotype information. (E) Same UMAP plot as in (D), showing the expression of stage-specific markers. (F) Same UMAP plot as in (D), showing inferred cell-cycle phase based on the expression of a large set of G2/M- and S-phase genes (Kowalczyk et al., 2015).

