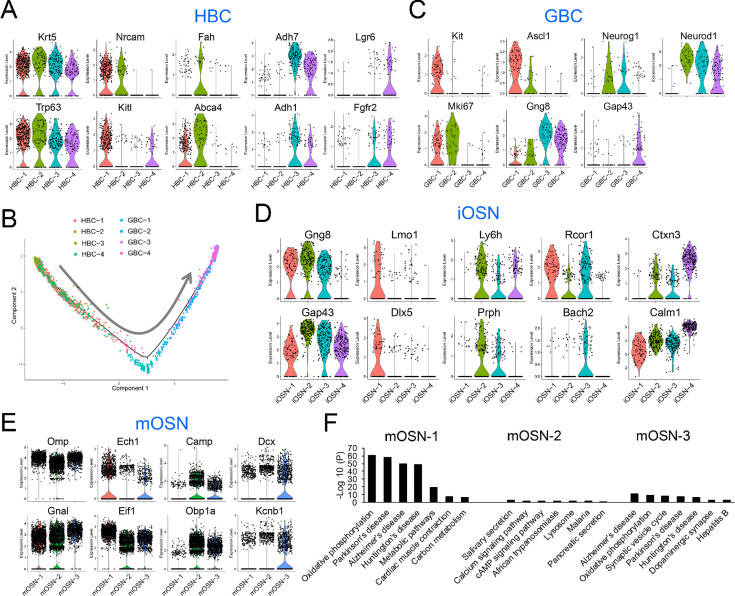
Figure 4. HBC, GBC, iOSN and mOSN heterogeneity.
(A) Violin plots showing the expression of selective gene markers in the four indicated HBC sub-clusters in WT mice. (B) Monocle trajectory analysis of the HBC and GBC sub-clusters we identified. The arrow indicates the inferred direction of differentiation. (C–E) Violin plots showing the expression of selective gene markers in the indicated GBC, iOSN, and mOSN sub-clusters in WT mice. (F) The most statistically enriched signaling pathways in the mOSN-1,–2, and −3 sub-clusters.

