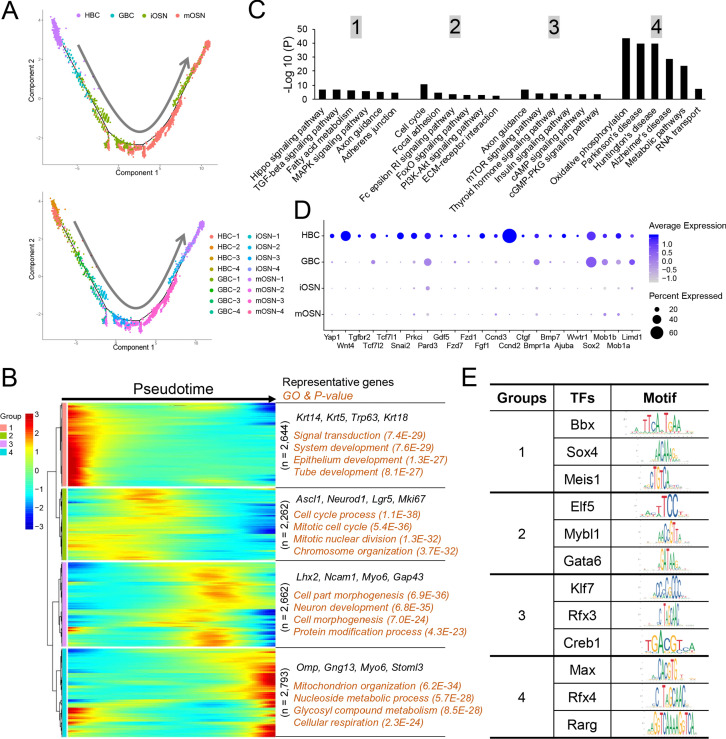
Figure 5. Gene groups exhibiting distinct expression dynamics during OSN development.
(A) Monocle pseudotime trajectory analysis of the indicated cell clusters and sub-clusters from WT mice defined in Figure 3B (top) and Figure 3D (bottom), respectively. (B) Heatmap depicting the expression pattern of the four gene groups we defined, each with a unique expression pattern, as defined by the trajectory timeline shown in (A), upper. Top: pseudotime directions; right: the number of differentially expressed genes in each group and representative biological processes and P-values. (C) The most statistically enriched signaling pathways corresponding to each of the four gene groups defined in (B). (D) Dot plot showing genes related to the Hippo signaling pathway are primarily expressed in HBCs. (E) Transcription factor genes exhibiting the most statistically enriched expression in each gene group defined in (B). Target sequences predicted by the ENCODE database are indicated.

