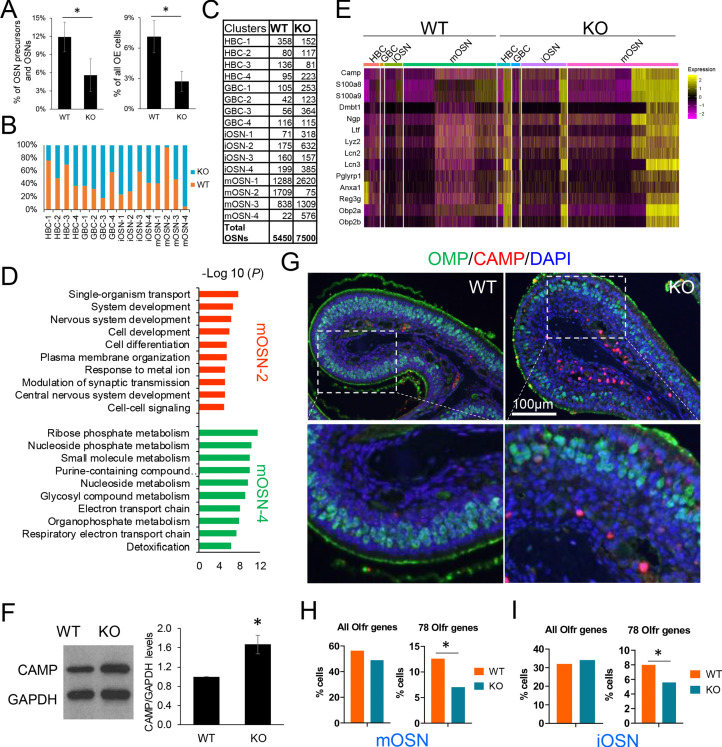
Figure 6. UPF3B shapes olfactory neurogenesis.
(A) The fraction of HBCs per all OSN precursors/OSNs (HBCs, GBCs, iOSNs and mOSNs) (left) or all OE cells (right), in Upf3b-null (KO) and WT mice, as determined by scRNA-seq analysis. *, p<0.05. (B) The percentage of cells from the indicated cell sub-clusters in Upf3b-null (KO) and WT mice, as determined by scRNAseq analysis. (C) Cell number in each cell sub-cluster, as defined in Figure 3D. (D) Most statistically enriched GO terms in the mOSN-2 and −4 sub-clusters. (E) Heatmap depicting the expression pattern of anti-microbial genes in the indicated cell subsets. (F) Left: Western blot analysis of endogenous CAMP protein level in the OE from Upf3b-null (KO) and WT mice. Right: quantification of CAMP level normalized against GAPDH (n = 3). *, p<0.05. (G) IF analysis of adult mouse OE sections co-stained with antisera against CAMP (red) and OMP (green). Nuclei were stained with DAPI (blue). (H, I) The percentage of mOSNs (H) and iOSNs (I) in our scRNAseq datasets that express Olfr genes. Left, all known Olfr genes. Right, the 78 Olfr genes significantly downregulated in Upf3b-null mice, based on RNAseq analysis (Figure 1C). *, p<0.05.


