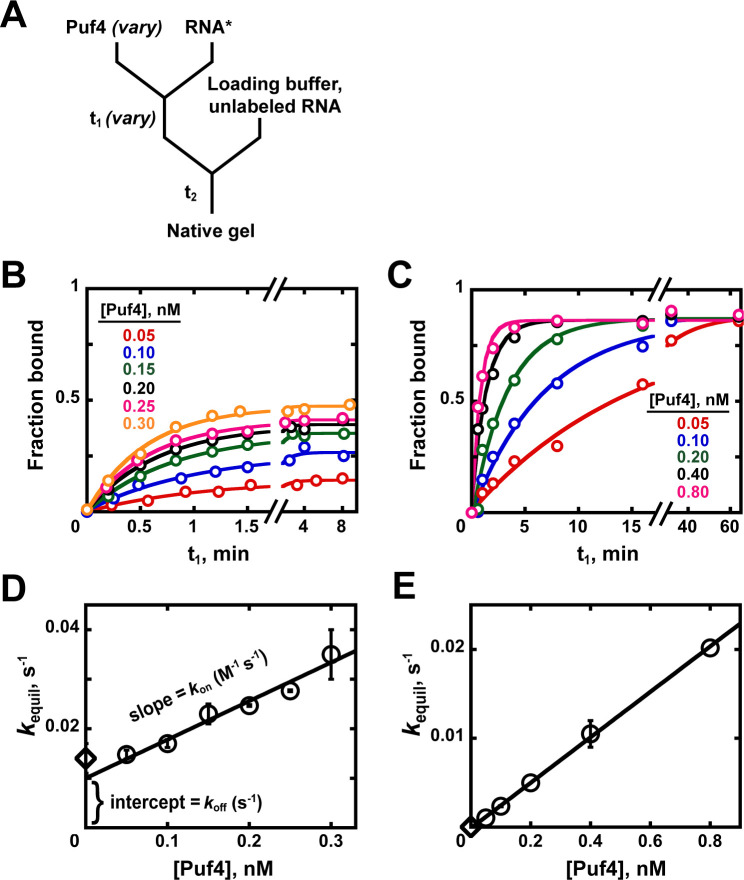
Appendix 1—figure 2. Kinetics of Puf4/RNA association.
(A) Mixing scheme for measuring association rate constants. (B, C) Time dependence of Puf4 association to its consensus RNA at 25°C (B) and 0°C (C). (D, E) Determination of kon from the slope of the Puf4 concentration dependence of equilibration rate constants in parts B and C, respectively (circles). The koff values from Appendix 1—figure 1 are also shown (diamonds) to illustrate the correspondence between the y-intercept and koff (Equation 1). Panels D and E show results from two and one independent experiments, respectively (error bars in E correspond to averages from measurements at two different labeled RNA concentrations).

