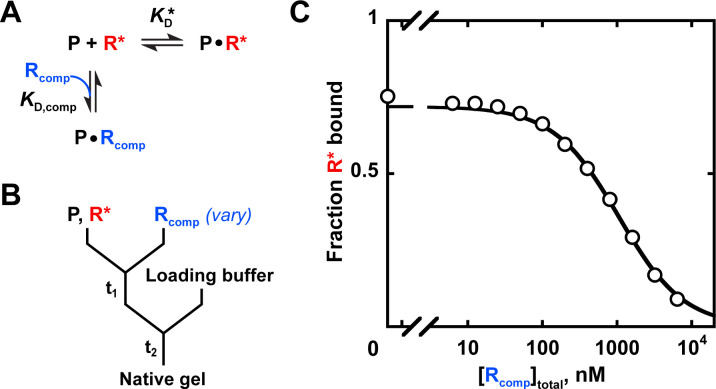
Appendix 3—figure 1. Measuring binding affinity by competition.
| (9) |
A indicates the maximum amplitude, constrained to the fit amplitude of the R* binding curve that is measured in parallel by a direct binding experiment (A = 0.89 for Puf4 binding to R*). O is the y axis offset (background). [R*]total was constrained to the lower limit of the labeled RNA concentration. was constrained to Puf4 affinity for the labeled RNA, as determined by direct measurement in the same experiment (0.105 nM, after accounting for active protein fraction of 75%). [P]total was 0.45 nM, after accounting for active protein fraction. The fit value was 204 nM. Incubation times of 10, 30, and 110 min gave consistent values (190–210 nM), as did lowering the protein concentration by three-fold (180 nM). Equation 9 is applicable only for . For other cases see Wang, 1995.

