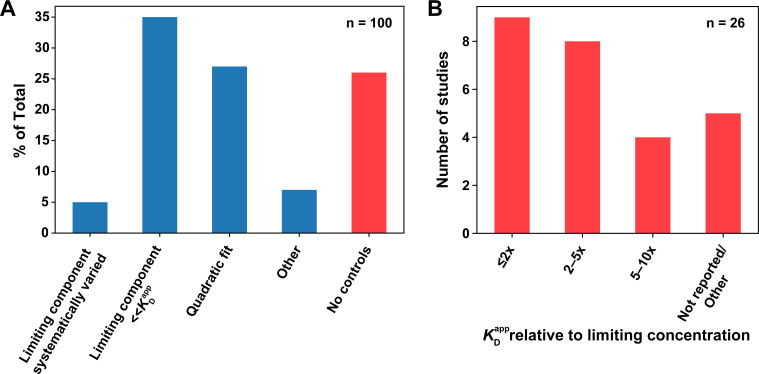
(A) Percentages of publications that did (blue) or did not (red) control for titration effects. The first category includes studies that systematically varied the limiting component concentration to rule out titration. Studies that reported using an appropriate concentration regime or analysis methods to minimize the effects of titration (second and third column, respectively) were considered titration controlled; nevertheless, we emphasize the importance of performing and reporting the control experiments described herein, instead of relying on concentrations alone (see section 'Avoid the titration regime'). The ‘Other’ category (n = 7) includes a study that reported KD values as upper limits, recognizing possible titration (n = 1), and studies that only used SPR (n = 6), where the concentration of the immobilized species is difficult to estimate, but mass transport is typically controlled for or accounted for during analysis, as indicated in most surveyed studies. (B) Breakdown of studies that did not report controlling for titration. The first three columns denote studies that assumed negligible concentration of the limiting component in their analysis; however, the reported concentrations and KD values were inconsistent with this assumption, with the ratio of the lowest measured KD value to the limiting component concentration indicated. The ‘Not reported/Other’ category includes studies that did not report the limiting component concentration (n = 4), or used the quadratic equation in a titration regime (limiting component concentration in >1000-fold excess over the KD), incompatible with reliable KD determination (n = 1; see below).


