. 2020 Aug 6;9:e57264. doi: 10.7554/eLife.57264

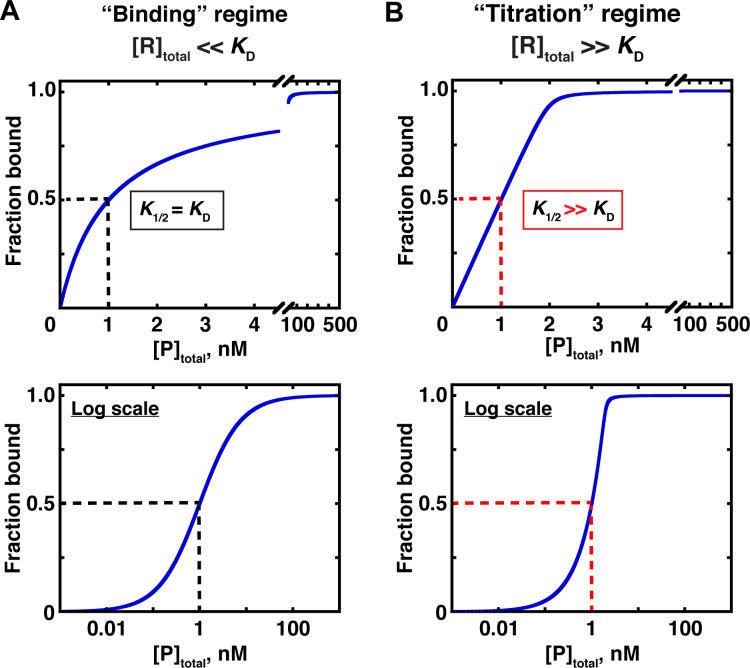
Figure 5. Two concentration regimes.

(A) Binding curve for the model in Figure 3 in the ‘binding’ regime—that is, the trace binding partner concentration ([R]total) is much lower than KD and much lower than [P]total (Equation 4b). Here, the KD is simply the protein concentration at which half of the RNA is bound (K1/2, here corresponding to 1 nM). The same simulated binding curve is shown in linear (top) and log (bottom) plots, as both are useful and common in the literature. (B) Binding curve in the ‘titration’ regime, simulated for an interaction with a KD value of 0.01 nM and an [R]total of 2 nM. Although the K1/2 value in this example is identical to the example in Part A, here it does not equal KD, instead exceeding the real KD value by 100-fold.

Figure 5.

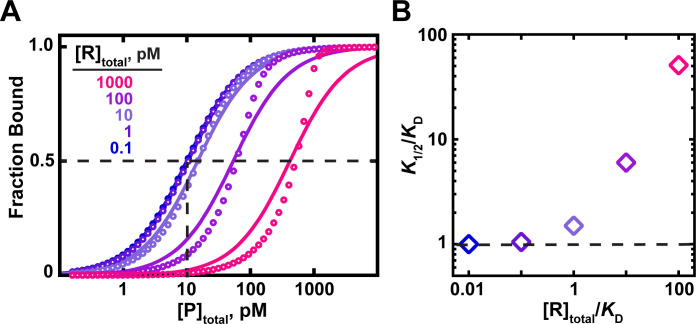
Figure 5—figure supplement 1. The effects of RNA (ligand) concentration on observed binding.

Figure 5—figure supplement 1.

(A) Circles indicate simulated data for an interaction with a KD = 10 pM in the presence of RNA concentrations ranging from 100-fold below to 100-fold above the KD. Curves indicate fits of the simulated data to a hyperbolic equation (Equation 4b). For RNA concentrations ≤10-fold below the KD, the data are well explained by a hyperbolic fit, and the protein concentration at which half-saturation occurs (K1/2; indicated with dashed lines for the 0.1 pM RNA curve) is consistent with the KD. Higher RNA concentrations lead to increasing deviations from a hyperbolic fit and have increasing K1/2 values as the RNA concentration increases. (B). The relationship between the observed K1/2 enhancement over the true KD (‘K1/2/KD’) and the total RNA concentration relative to KD (‘[R]total/KD’). K1/2 values were derived from the simulated data in part A using Equation 4b.
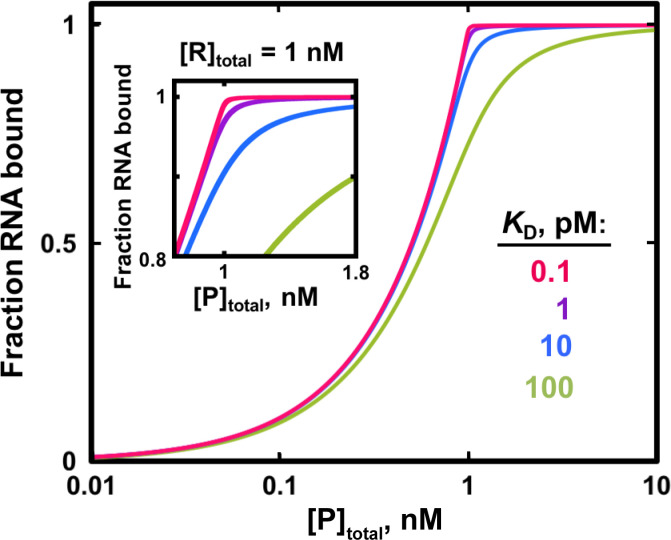
Figure 5—figure supplement 2. Fit to the quadratic binding equation becomes less sensitive to differences in KD when the RNA concentration is in large excess over the KD.

Figure 5—figure supplement 2.

Simulated binding curves for RNA/protein interactions of varying affinities are shown in the presence of 1 nM labeled RNA. In this example, KD = 1 pM (1000-fold lower than [R]total) would be essentially impossible to distinguish from KD = 0.1 pM (10,000-fold lower than [R]total) and from even lower KD values because of the nearly identical binding curves. To accurately measure KD = 10 pM (100-fold lower than [RNA]) it would be critical to have a large number of data points in the narrow protein concentration range that distinguishes this curve from weaker and especially from stronger binders (inset).
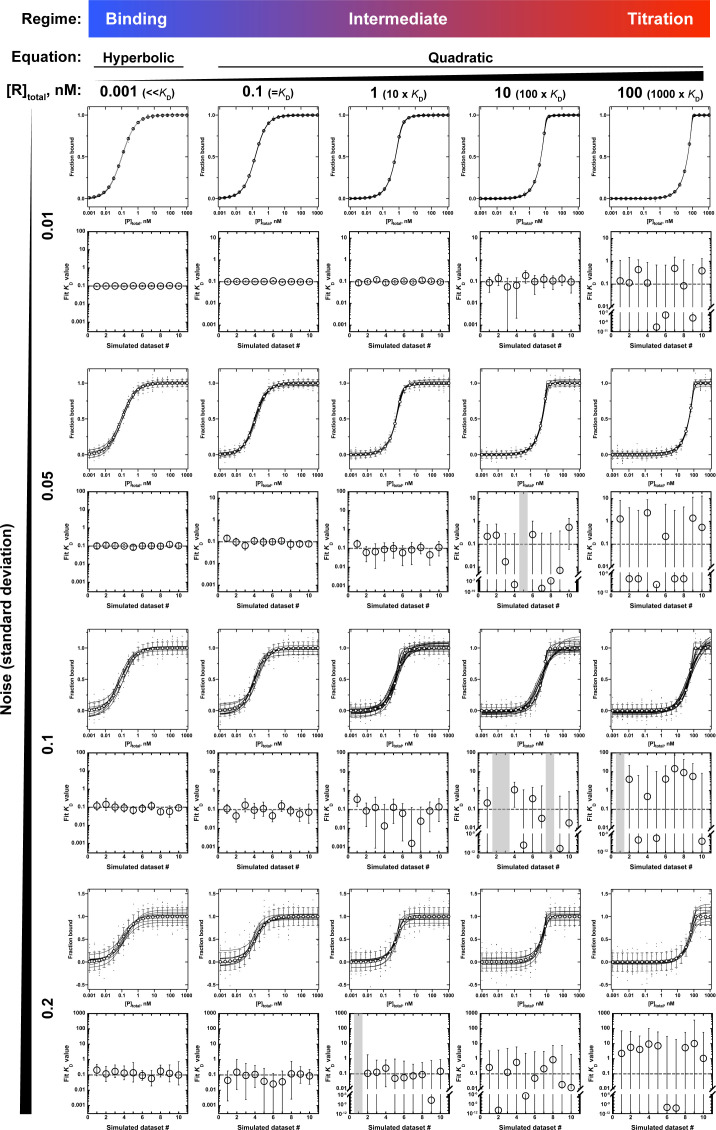
Figure 5—figure supplement 3. Application of the hyperbolic (Equation 4b) and quadratic (Equation 5) binding equations to simulated binding data with increasing noise levels.

Figure 5—figure supplement 3.

All binding curves are for an RNA-protein interaction with a KD of 0.1 nM, measured in the presence of different RNA concentrations (0.001–100 nM) and with increasing levels of random noise in the fraction bound (standard deviation of 0.01–0.2). Ten datasets were simulated per condition and noise level and were individually fit to Equation 4b (leftmost column) or Equation 5 (the remaining columns) to determine the KD. The binding curves are shown as black lines, and the overlaid white circles indicate the expected fractions bound if the data were not affected by noise, with error bars indicating the standard deviation. The fit KD values for each of the 10 simulated datasets are shown below each set of binding curves, and the error bars indicate the 95% confidence intervals (CIs) of the KD. Gray bars indicate that the KD could not be determined from a quadratic fit. CIs that extend beyond the axis limits indicate that the lower limit of the KD was not defined. Note that with increasing noise and increasing RNA concentration the KD values derived from the quadratic fits become increasingly poorly constrained, particularly the lower CIs. By contrast, using the binding regime and Equation 4b to fit the data (leftmost column) consistently yields well-defined KD values, even with substantial noise.
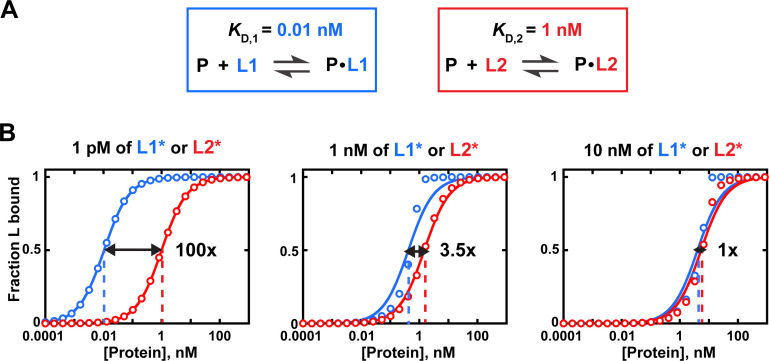
Figure 5—figure supplement 4. Effects of trace binding partner concentration on apparent relative affinities.

Figure 5—figure supplement 4.

(A) Affinities of protein P for ligands L1 and L2. (B) Simulated equilibrium binding curves. Binding to each ligand is measured individually with different concentrations of labeled ligand (L1* or L2*). Solid lines are fits to Eq. 4b, with dashed lines indicating the protein concentration at which half of the ligand is bound (corresponding to KD in Equation 4b). Arrows and numbers indicate apparent KD(rel) values at each concentration of L (KDapp(rel) = KD,2app/KD,1app; with KD,1app and KD,2app derived using Equation 4b). There is a pronounced dependence of apparent relative affinity on ligand concentration if [L] is not much lower than the KD for the most tightly bound ligand among the ligands being compared. If sufficiently low ligand concentrations are not accessible, Equation 5 should be used and results may be less reliable (see section 'Avoid the titration regime' of main text).
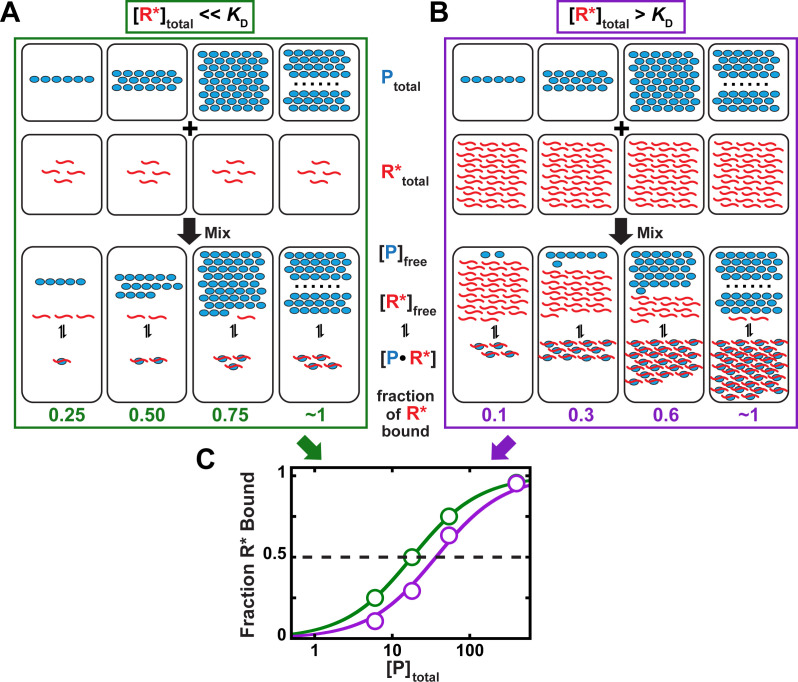
Figure 5—figure supplement 5. Concentration regimes that do not (A) and do (B) affect the determination of equilibrium binding constants.

Figure 5—figure supplement 5.

(A) Labeled RNA concentration is much lower than KD ([R*]total << KD; binding regime). (B) Labeled RNA concentration is greater than KD ([R*]total > KD; intermediate regime). In parts (A) and (B), concentrations are indicated schematically by the number of RNA (R*, red), protein (P, light blue) molecules and RNA-protein complexes (P●R*) shown. In each case, protein concentration is varied (6, 18, 54, 400 arbitrary units), and KD equals 18 (in the same units). The total RNA concentration is 4 (A) and 36 (B). (C) Protein concentration dependence of binding in each of the above regimes. In the binding regime (green, [R*]total << KD from part A), the protein concentration at which half of the RNA is bound corresponds to the KD. In contrast, in the intermediate regime (purple, [R*]total > KD from part B), a greater protein concentration is required to achieve half-saturation (40 vs. 18 arbitrary units). The discrepancy would further increase with higher RNA concentrations, as shown in Figure 5—figure supplement 1. We can understand the origin of this discrepancy as follows. In part (A), the RNA concentration (red) is below the KD value and below the protein concentration (blue), such that the free concentration of the protein is essentially unchanged after RNA binding at both saturating (complete binding of RNA) and sub-saturating protein concentrations. Changing the RNA concentration in this regime would not change the fraction of RNA bound at a given total protein concentration, as long as the [R*]total << KD condition remains met. On the contrary, in part (B), the RNA concentration exceeds the dissociation constant (KD) and is high enough that a large fraction of the total protein is bound by RNA. Thus, the free protein concentration, which determines the extent of binding according to Equation 4a, is depleted and can no longer be approximated by the total protein concentration in Equation 4b to obtain an accurate KD value. On the molecular scale, the lowered free protein results in less binding. Consequently, for a given KD, more protein is required to achieve half-saturation at higher RNA concentration than with a trace concentration of RNA. Intuitively, at a concentration of RNA that is greater than KD there simply isn’t enough protein to occupy half the RNA when the total protein concentration is equal to KD.