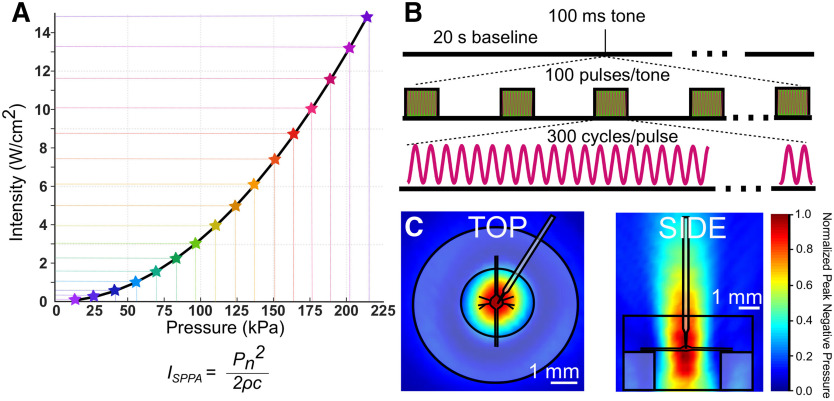
Figure 2.
US parameters. A, In this graph, all the pressures used in this study and their corresponding intensities (spatial peak pulse average) are indicated. Intensities were calculated using the equation shown in A, where Pn = pressure; Þ = density of nerve tissue, estimated to be 1.03 × g/cm3; c = speed of sound in saline medium, estimated to be 1507 m/s. B, US pulse parameters; 960-kHz US was applied for a single tone of 100-ms duration. Tones consisted of 100 pulses of 300 cycles of US (313-μs pulse duration). C, Linearly interpolated pressure distribution maps overlaid with scale preparation, dish, and electrode.

