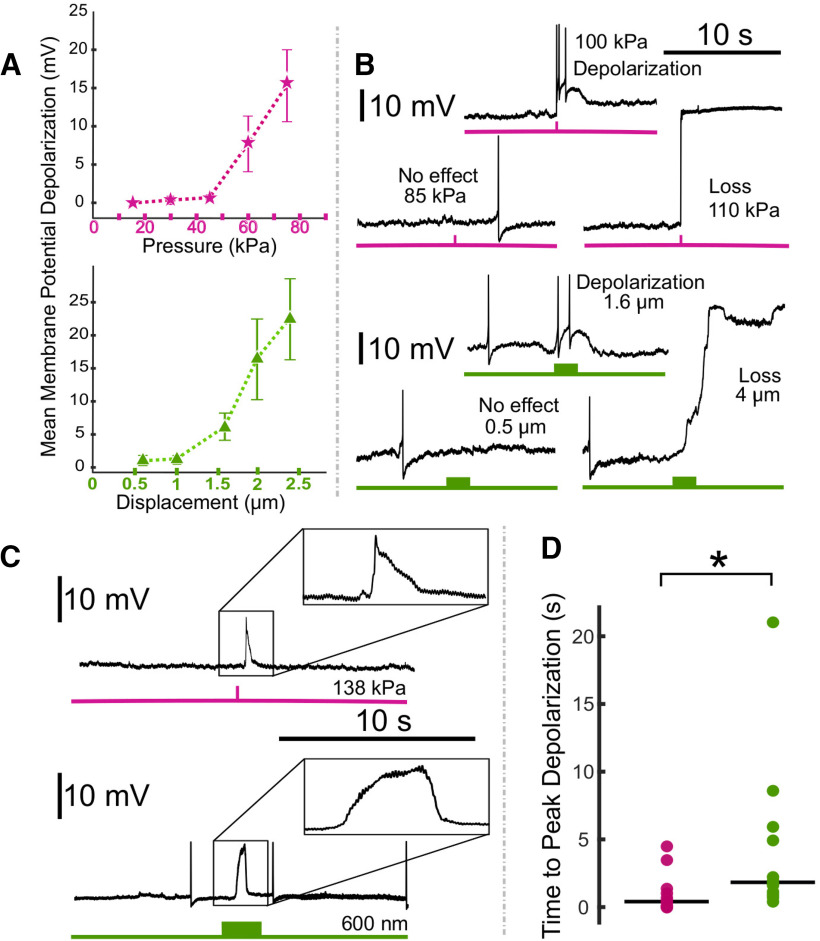
Figure 3.
Comparison of the effects of US and electrode displacement on the resting membrane potential of Retzius neurons. A, Plots demonstrating changes in mean membrane potential in response to US applied at increasing pressures (upper plot, pink) and electrode displacements of increasing distance (lower plot, green), aggregated across preparations. Error bars denote SEM. B, Intracellular recordings demonstrating effects of US applied at increasing pressures to the same cell (pink, upper); recordings demonstrating effects of electrode displacement at increasing distances on the same cell (green, lower). C, Intracellular recordings demonstrating typical waveforms of depolarizations elicited by US (upper) and electrode displacement (lower). D, Scatter plots comparing time to peak depolarization following start of US (pink) and electrode displacement (green). Horizontal lines denote medians. The difference between the two was significant (Z = 2.6275, *p = 0.0086, Wilcoxon rank-sum test).

