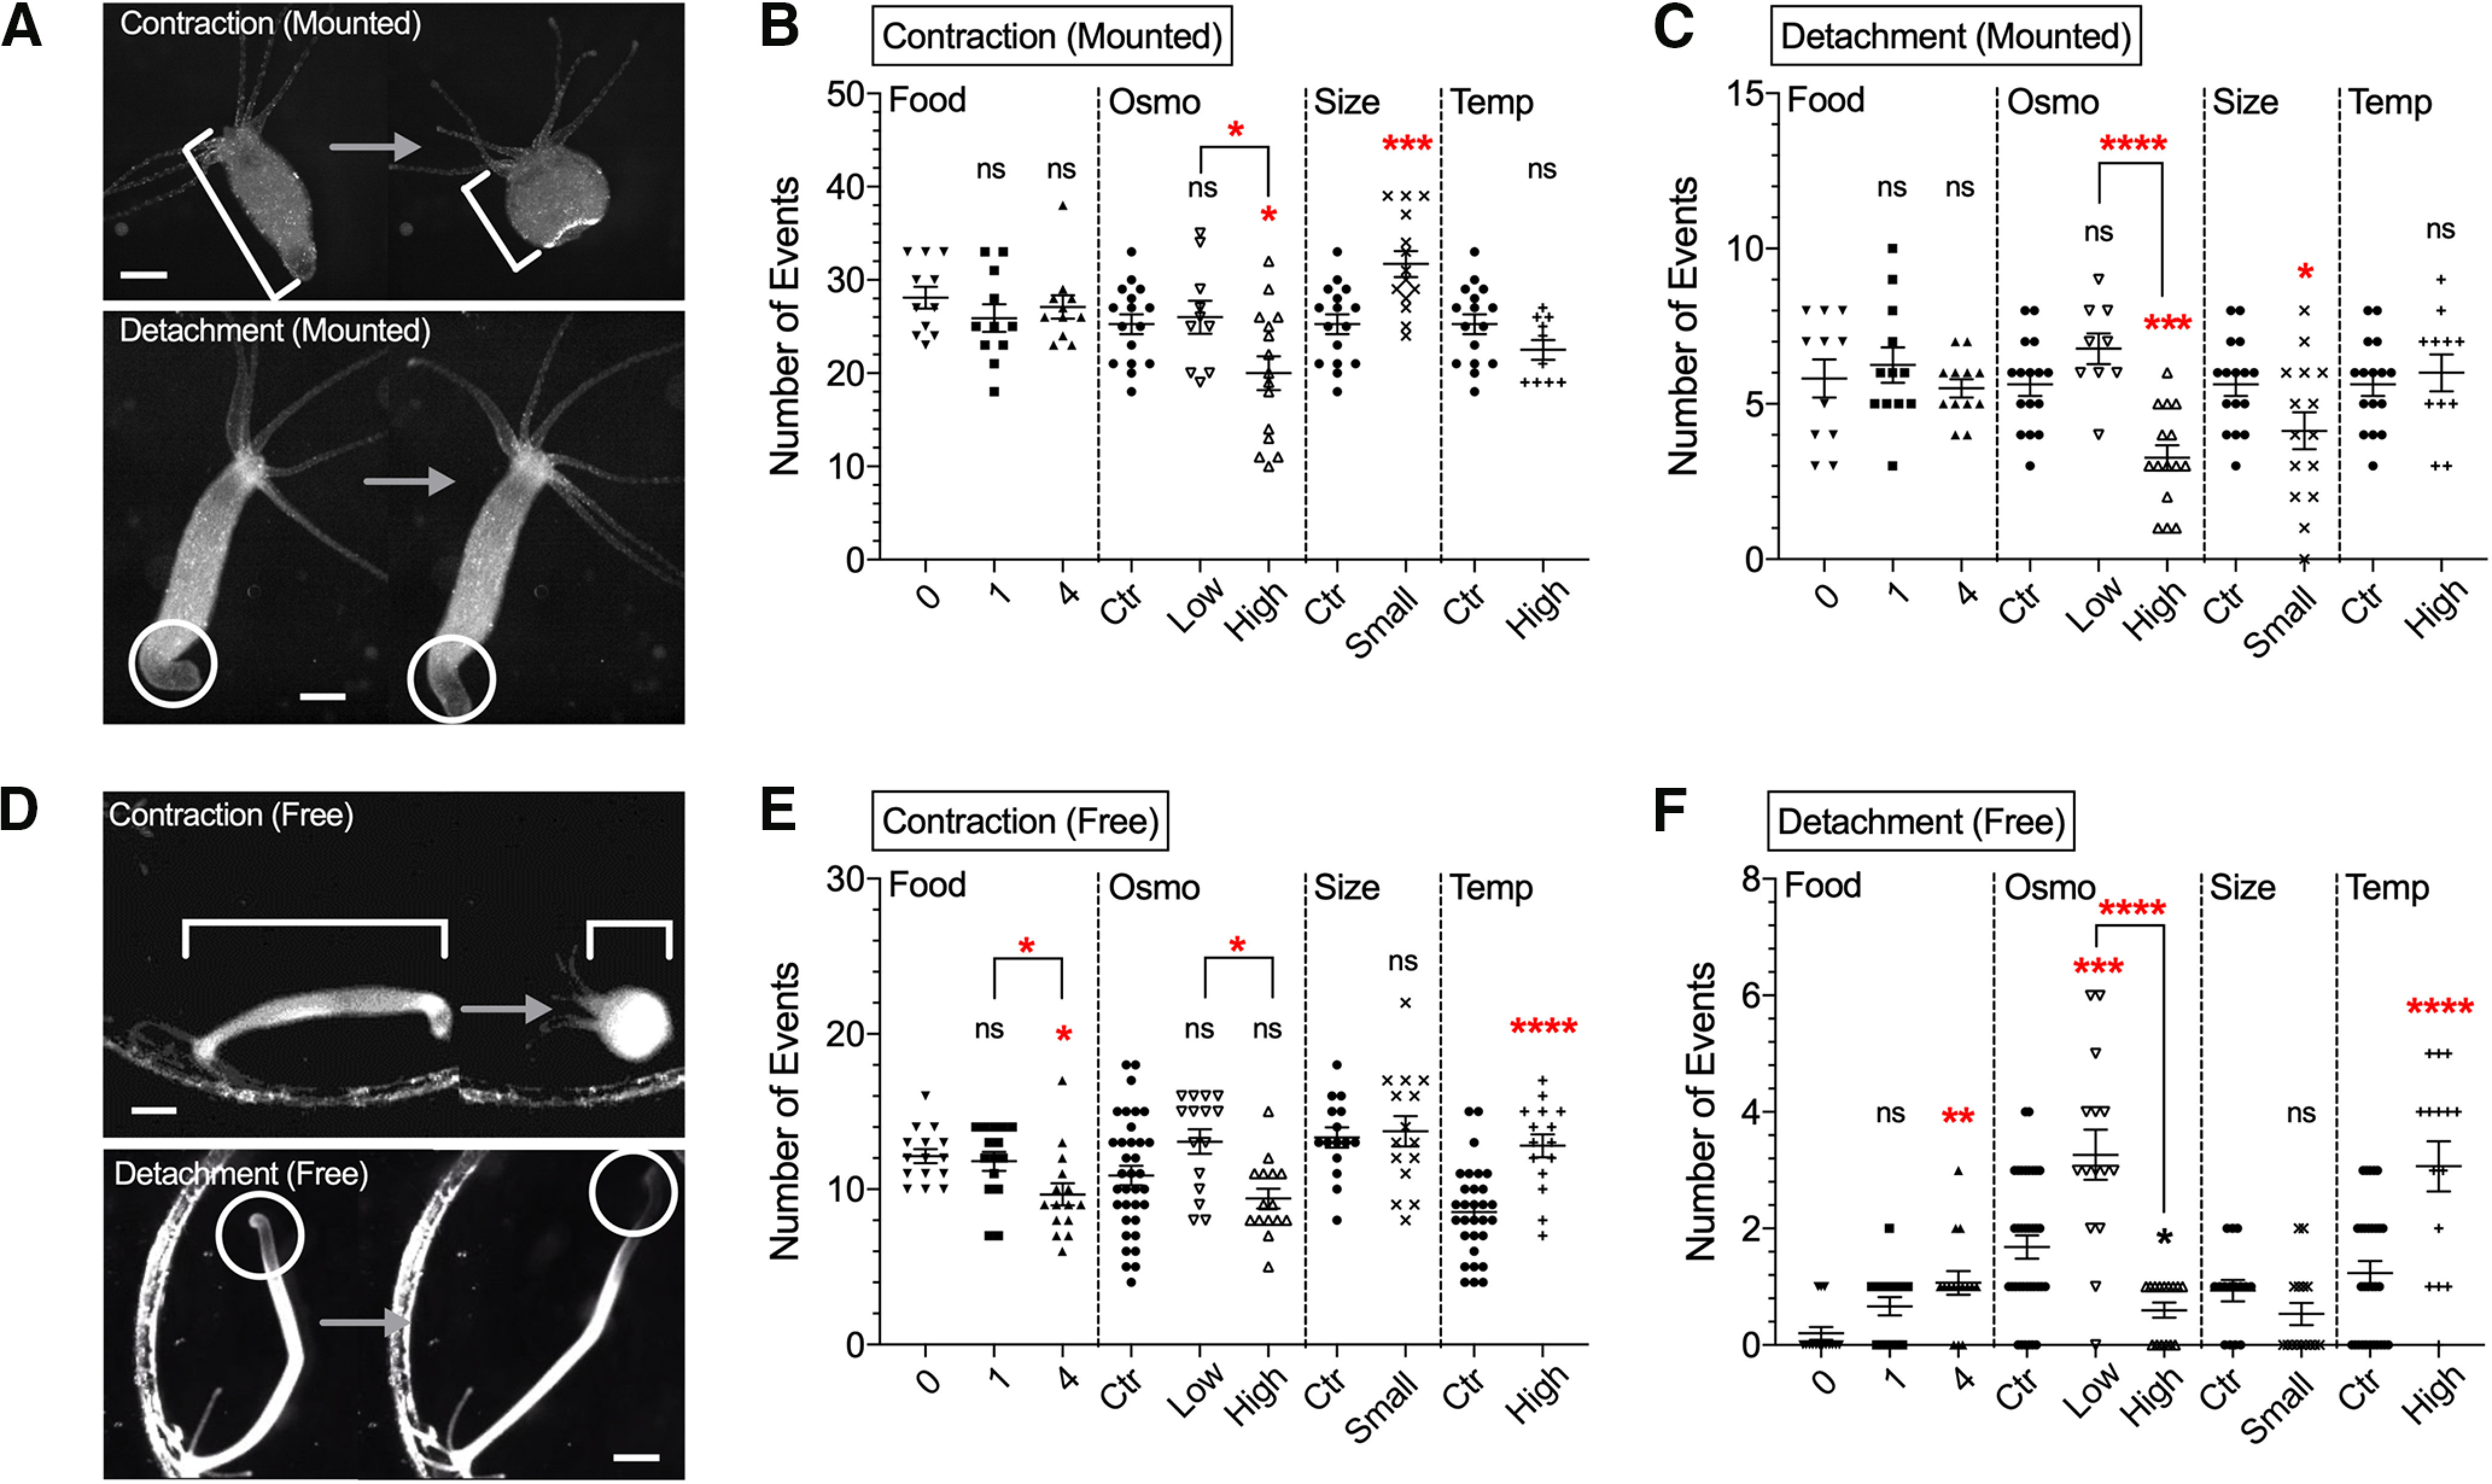
Figure 1.

Effect of experimental conditions on contractions and locomotion behavior. Data from mounted preparations in A–C and from 1-h freely moving Hydra in D–F. A, Upper images, Changes in body length during longitudinal contractions. Lower images, Foot detachment. Scale bar, 500 μm. Number of contractions (B) and foot detachments (C) were counted. D, Upper images depict changes in body length during longitudinal contractions. Lower images depict foot detachment followed by locomotion. Scale bar, 1 mm. Number of contractions (E) and foot detachment/locomotion (F) were counted. The four conditions used were food (Food), osmolarity (Osmo), size (Size), and temperature (Temp). Control medium (ctr). Error bars shown as mean ± SEM, with symbol marks denoting data points from individual Hydra (N = 9–16 for B, C; N = 15–30 for E, F). Tukey’s multiple comparisons tests were performed following one-way ANOVA for osmolarity experiment, and Student’s t test was performed for others: ns ≥ 0.05; *p < 0.05, **p < 0.01, ***p < 0.001, ****p < 0.0001.
