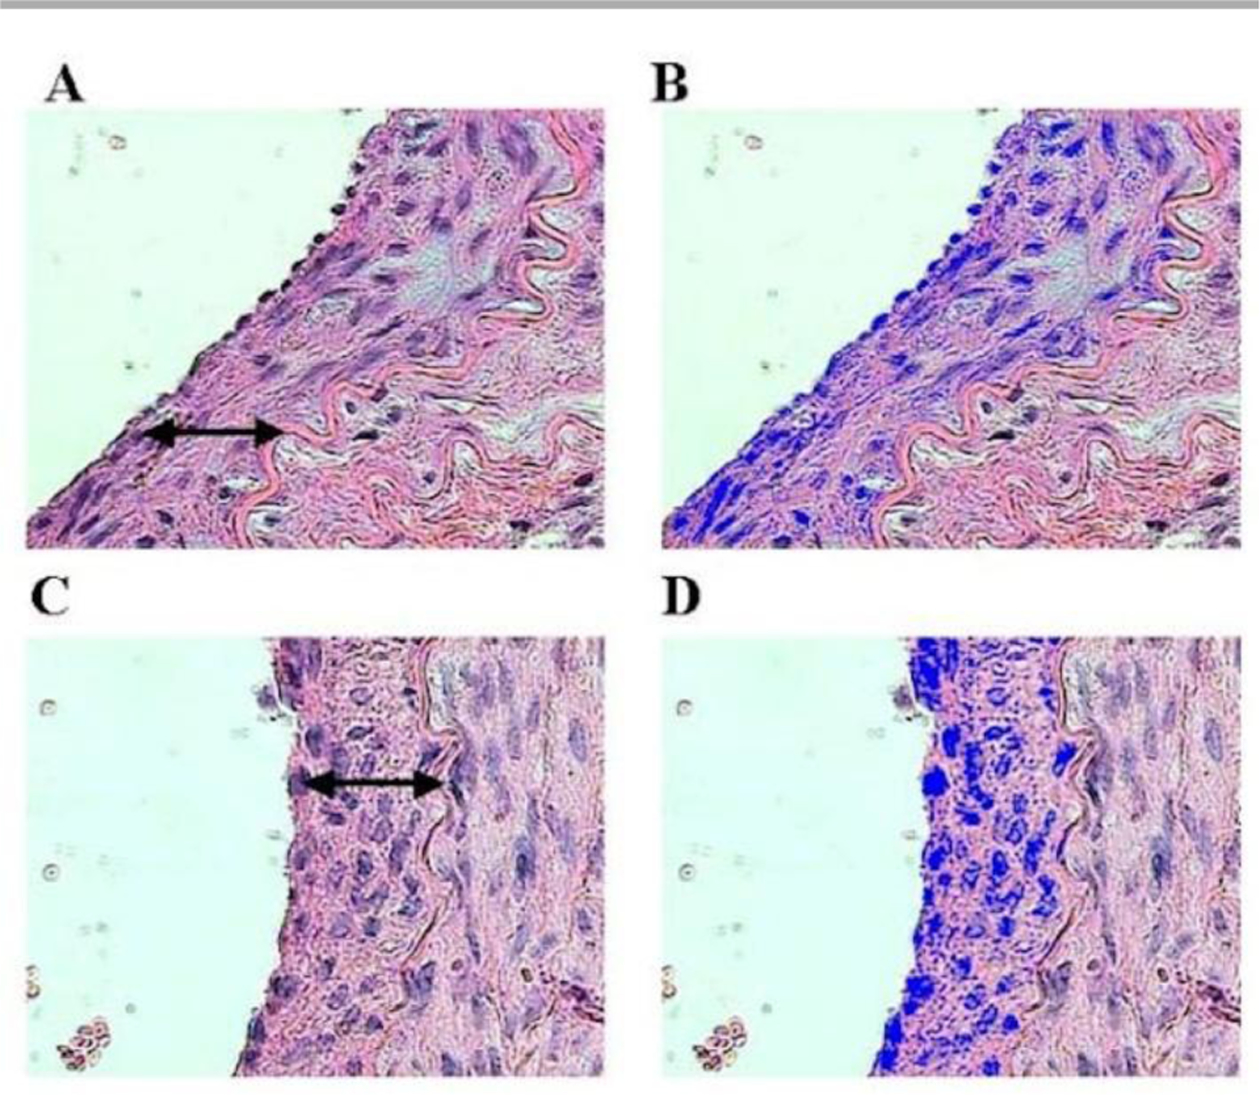
Figure 1.

Photomicrographs by Costa et al. showing the nuclei of smooth muscle cells in intimal hyperplasia (↔), stained in blue. Irradiated group in A (21 days) and B image analysed by the computer system; control group in C (21 days) and D image analysed. (hematoxylin and eosin – 10x magnification).37
