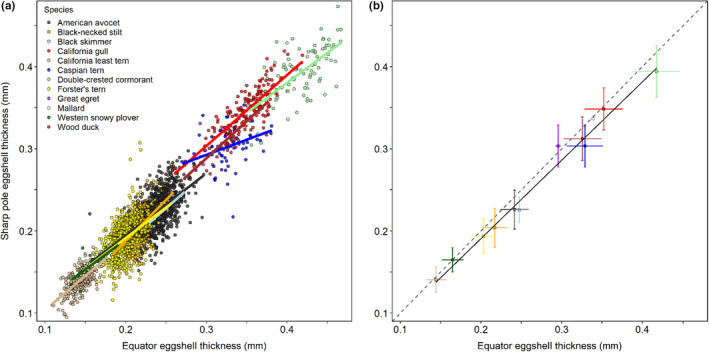
FIGURE 3.

Eggshell thickness at the sharp pole was related to eggshell thickness at the equator during 2014–2018. (a) Individual eggshell measurements are shown with slopes for each species from individual species regressions. (b) Mean (± SD) eggshell thickness values (raw data) are shown for each species on top of the among‐species regression based on the species’ mean values. The solid line is the regression line (sharp pole thickness [mm] = (0.95300 × equator eggshell thickness [mm]) + 0.00029), shown for the range of the data means in the present study, and the dashed line indicates a theoretical 1:1 relationship
