
Figure 1.
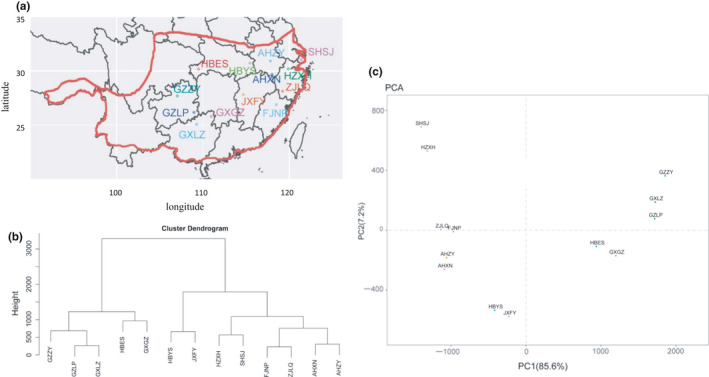
Sampling map of Quercus fabri in China. (a) Map showing the sampling locations. The natural distribution range of Quercus fabri has been marked with a red line. (b) Cluster analysis of the sampling locations. (c) PCA clustering of the sampling locations