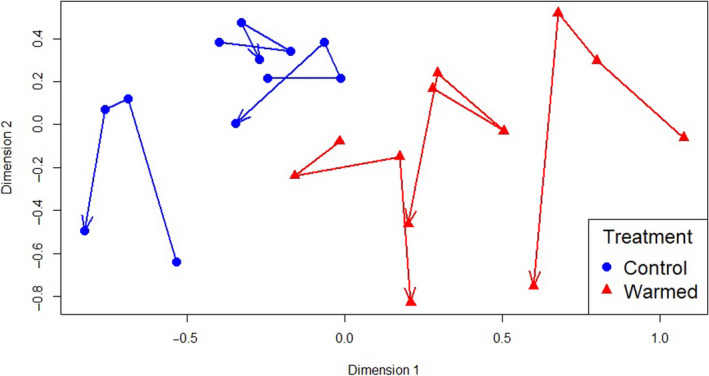
FIGURE 4.

Nonmetric dimensional scaling analysis showing similarities in herbaceous species composition between the control (n = 3, in blue) and warmed (n = 3, in red) plots over four years (2015– 2018), with one data point per plot per year. Lines connect values from a single plot in chronological order and display the individual trends over time. Points that are closer together represent plots and years that had more similar species composition. The first point in each line represents October 2015 (baseline survey), the second point July 2016 (prewarming), the third point August 2017 (1 year postwarming), and the last point September 2018 (1 year posthurricane)
