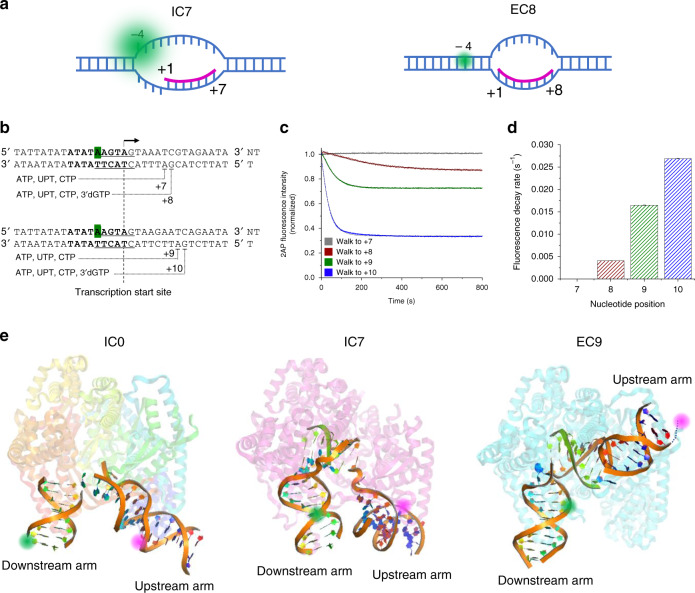
Fig. 3. The transcription initiation bubble collapses upon transition to elongation.
a Schematic illustration showing IC7 with the initiation bubble and a 7-nt RNA (magenta) annealed to the template DNA from positions +1 to +7. The template bases from −4 to −1 are single stranded, resulting in a strong fluorescence signal of 2AP at position −4 of the non-template strand (green). At position +8, EC8 is shown where the initiation bubble has collapsed and the −4 to −1 region is reannealed, resulting in the quenching of 2AP fluorescence. b Design of DNA templates used for 2AP fluorescence measurements, to be stalled at positions +7, +8, +9, and +10. c Changes in 2AP fluorescence measured along in vitro transcription reactions to the indicated positions, normalized against the initial intensity. The intensity traces were fit to a single-exponential decay curve to determine the transition rates. d Fluorescence decay rates measured from c at different walking positions. e Models of the IC0, IC7, and EC9 structures generated using PyMOL (Schrödinger, USA). IC0 was modeled using PDB 6erp (human mitochondrial RNA polymerase initiation complex), IC7 was modeled using PDB 3e2e (bacteriophage T7 RNA polymerase initiation complex with 7 bp RNA:DNA), and EC9 was modeled using PDB 4boc (human mitochondrial RNA polymerase elongation complex with 9 bp RNA:DNA). The green and magenta balls represent the Cy3 and Cy5 fluorophores at positions +11 and −11, respectively. The double-stranded DNA and RNA:DNA hybrid (RNA in green) is highlighted as bound to the protein in the background.

