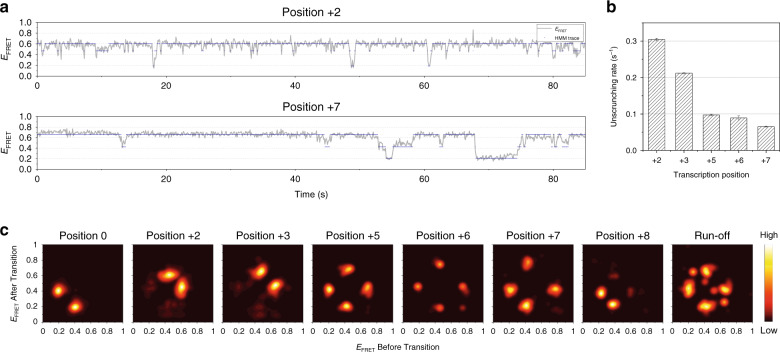
Fig. 4. Hidden Markov analysis throughout the initiation and elongation stages.
a Representative smFRET traces (gray) at positions +2 and +7 shown alongside hidden state traces (navy) from hidden Markov modeling assuming three hidden states. b Unscrunching rates obtained from the hidden Markov analysis at each stalling position during initiation. Error bars represent the error in transition rate estimation in the hidden Markov analysis. c Transition density plots from hidden Markov analyses of traces at each stalling position. The 509, 184, 162, 45, 98, 51, 67, and 27 traces were used for positions 0, +2, +3, +5, +6, +7, +8, and run-off conditions, respectively.

