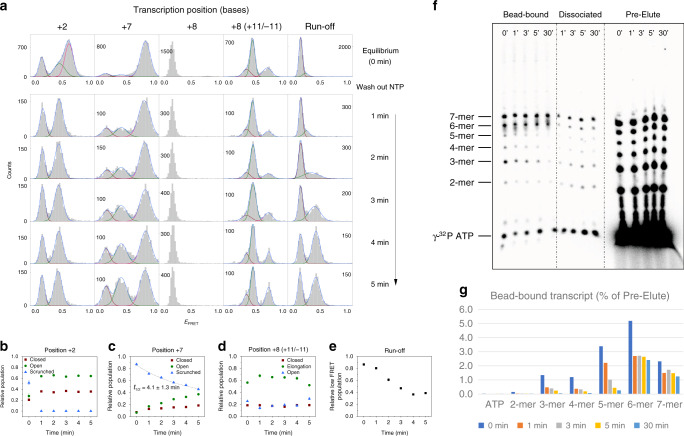
Fig. 5. The rate of abortive initiation sharply depends on the transcription position.
a FRET histograms obtained at equilibrium and after washing out the NTP mixture for positions +2, +7, and +8, and run-off conditions. For position +8, results from DNA template +11/−11 are included to distinguish between the populations of the elongation complex and DNA only. Each histogram was obtained from 12 short movies taken during each minute after washing out the NTP mixture (Supplementary Table 1). b, c Time traces of the relative populations of closed (low FRET), open (mid FRET), and scrunched (high FRET) complexes obtained from histograms at positions +2 (b) and +7 (c). Each graph was fit to a single-exponential decay curve, and the half-life is shown. In c, the graph of the scrunched population was fit to a single-exponential decay curve, and the half-life is shown. d Time trace of the relative populations of closed (low FRET), open (high FRET), and elongation (mid FRET) complexes obtained from histograms at position +8 on DNA template +11/−11. e Time trace of the relative low FRET population obtained from histograms under run-off conditions. In b–e, the error bars represent the error in the relative populations originating from the error in estimating the areas under the Gaussian curves. f Gel electrophoresis image of abortive transcripts from bead-based in vitro transcription assay, stalling at position +7. Each nucleotide length is marked. The time delay between NTP washout and the collection of bead-bound transcripts is shown (0–30 min). The experiment was repeated three times showing similar results. g Quantified percentage of bead-bound transcripts over transcripts in pre-elute, which are the products from 15 min transcription reaction before NTP washout.

