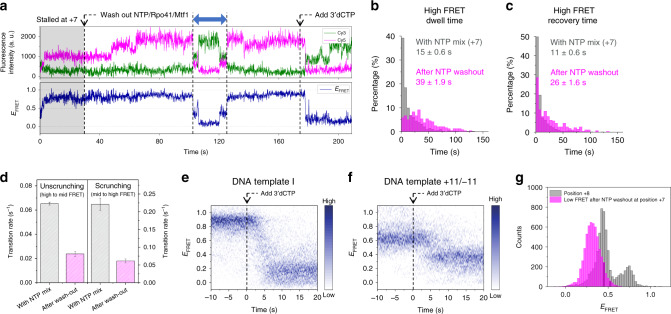
Fig. 6. The stalled initiation complex makes conformational transitions without dissociating RNA.
a Representative smFRET trace showing the conformational dynamics of the TIC of DNA template II equilibrated at position +7 (gray region; 0.5 mM each of ATP, GTP, and UTP) after washing out the NTP mix (first arrow). Subsequently, 0.5 mM 3′dCTP was added to promote progression to position +8 (second arrow). The abrupt drop in the FRET efficiency indicates successful progression to position +8. b Dwell time histogram of the high FRET (scrunched) state in the presence of NTP mix (gray; 809 events) and after NTP washout (magenta; 214 events). c The time taken to recover the high FRET state after dropping to lower FRET levels (blue arrow in a) in the presence of NTP mix (gray; 843 events) and after NTP washout (magenta; 284 events). d Comparison of unscrunching and scrunching rates in the presence of NTP mix and after NTP washout, measured as the inverse of average dwell times in b and c. Data represent mean and s.e.m. from three independent measurements. e, f FRET evolution maps generated from the traces supplied with 0.5 mM 3′dCTP after long stalling at position +7 by washing out the NTP mix, synchronized at the moment of flowing in 3′dCTP (0 s). The 53 and 41 traces were used for the maps generated for DNA templates II and +11/−ID + βID 11, respectively. g Using DNA template +11/−11, FRET histogram of low-FRET events after NTP washout at position +7 (magenta) was compared to that of position +8 (gray, from Fig. 2d).

