Fig. 2.
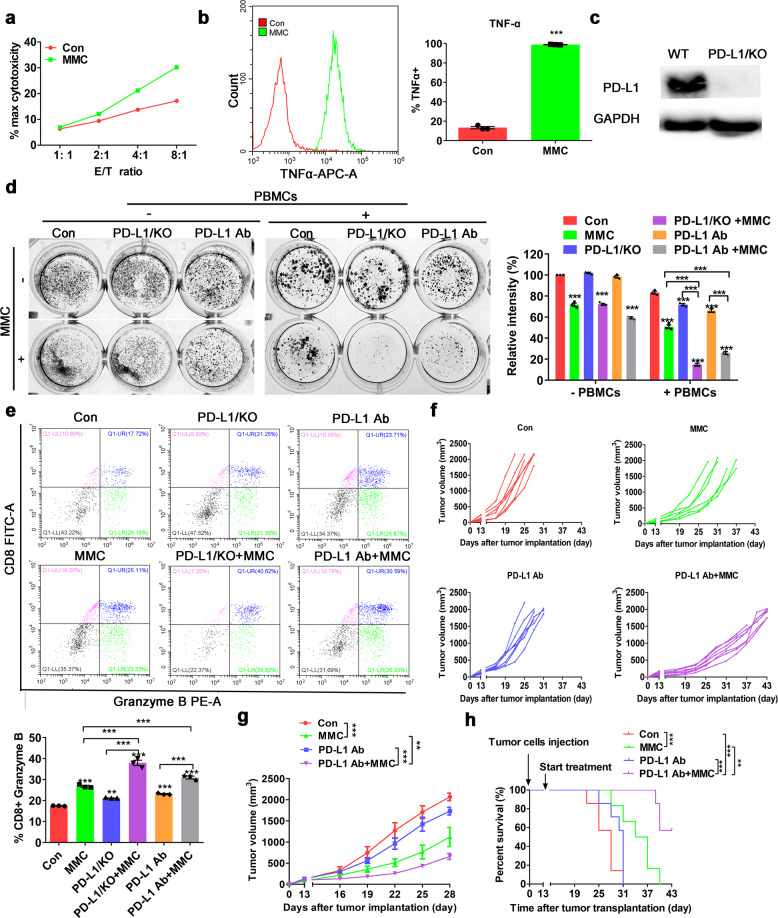
Combination of PD-L1 blockade and MMC produced a synergistic antitumor effect. a LDH assay in H460 cells pretreated with MMC (0.4 μM, 24 h). Effector cell (E): PBMC; Target cell (T): H460. b Intracellular cytokine staining of TNF-α for CD3+ T cells population after incubation with MMC-pretreated H460 cells (0.4 μM, 24 h) for 12 h. The left histogram shows the data from a representative experiment. Means ± S.D. presented on the right bar graph summaries the results from triplicate experiments. c The PD-L1 protein expression is essentially knocked out in PD-L1/KO H460 cells. d T cell-mediated tumor cell killing assay in PD-L1/KO cells and wild-type control cells with or without MMC pretreatment. Activated T cells and cancer cells were co-cultured in 24-well plates for 4 days and then surviving tumor cells were visualized by Giemsa staining. Relative fold ratios of control cells were summarized in the bar graph. e Intracellular cytokine staining of granzyme B of CD8+ T cells populations after incubation with H460 cells (with or without MMC-pretreatment). Results were presented in the bar graph as means ± S.D. from triplicate experiments. f, g The tumor volume curves of LLC-tumor bearing C57BL/6 mice in the four different treatment groups (n = 6). f The tumor volume in individual mouse. g The mean ± S.D. value from the six mice in each treatment group. h The Kaplan–Meier curves and log-rank test of overall survival analysis of LLC-tumor bearing C57BL/6 mice in the four different treatment groups (n = 6). *p < 0.05, **p < 0.01, ***p < 0.001

