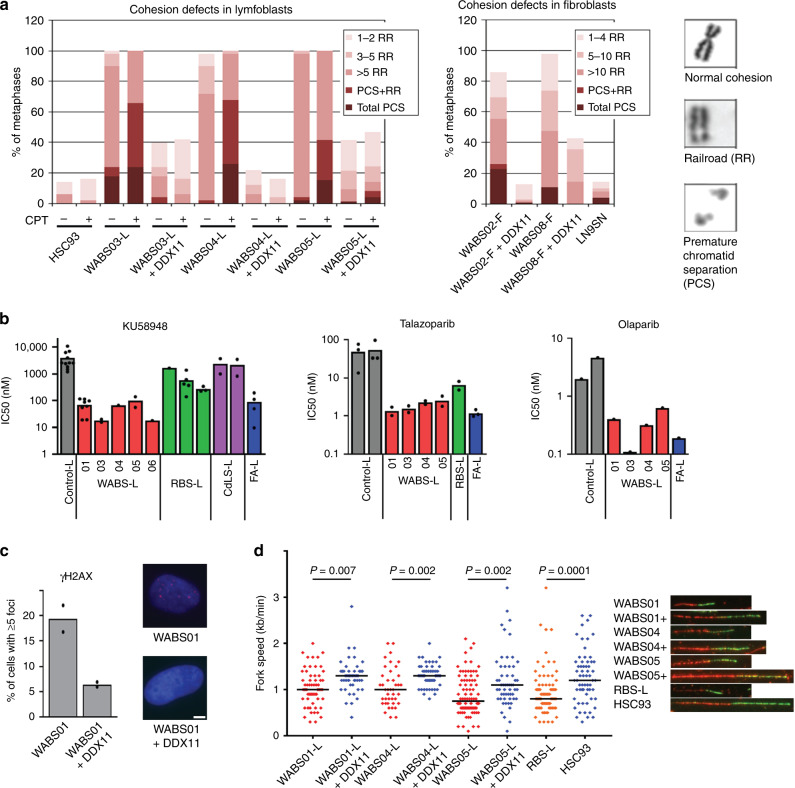
Fig. 2. WABS cells display cohesion loss, PARPi sensitivity, DNA damage and replication stress.
a Cohesion defect analysis of WABS cells. Per condition, in total 100 metaphases from two independent experiments were assessed. CPT = 2.5 nM Camptothecin treatment for 48 h. Examples of a normal chromosome, a railroad chromosome (RR) and premature chromatid separation (PCS) are shown. b Lymphoblasts from different patients were continuously exposed to increasing concentrations of PARP inhibitors KU58948, talazoparib and olaparib. After three population doublings of untreated cells, cells were counted and the amounts were determined as percentage of untreated cells. IC50 values from each dose-response curve were determined using curve fitting. Some KU58948 IC50 values were calculated from previously reported dose-response curves50. c Immunofluorescence detection of γH2AX foci. n = 100 in two independent experiments. Representative example pictures are shown with DAPI in blue and γH2AX in red. Scale bar, 5 µm. d Replication fork speed of WABS lymphoblasts was assessed with a DNA fiber assay using a double labeling protocol. 50 fibers were scored per condition. Example tracks are shown on the right. Blue dots, DDX11 proficient; red dots, DDX11 deficient; orange dots, ESCO2 deficient RBS lymphoblasts (positive control). Black lines indicate the median. P-values were calculated by a non-parametric one-way ANOVA test.

