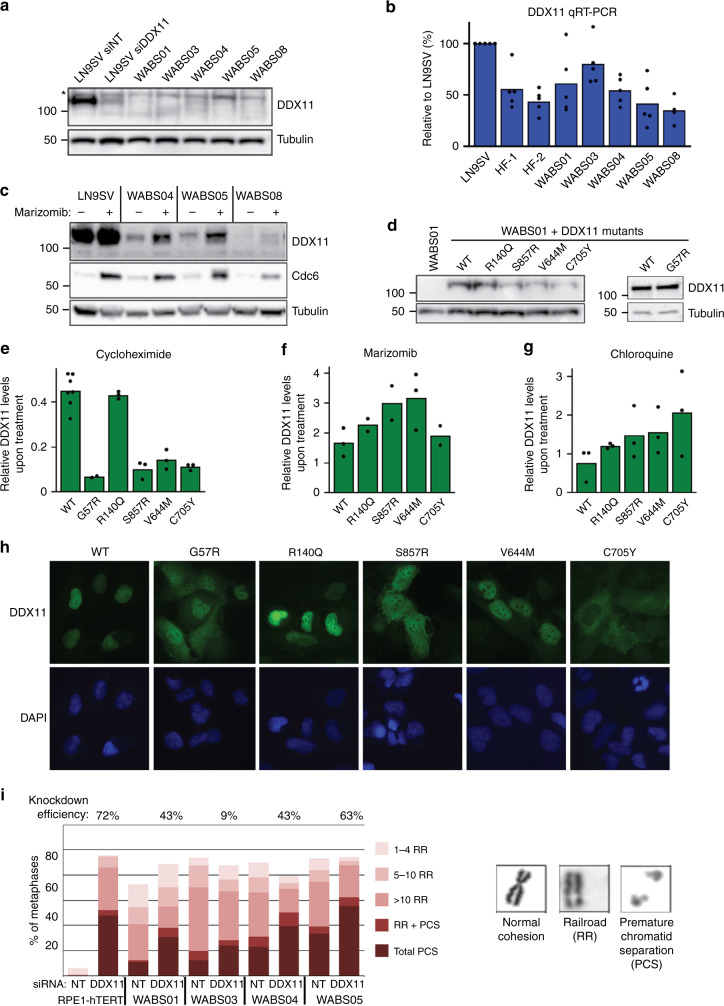
Fig. 3. DDX11 missense alleles reduce protein stability.
a WABS fibroblasts were analyzed for DDX11 protein levels by western blot. As control, LN9SV fibroblasts were transfected with non-targeting or DDX11 siRNA for two days. The asterisk indicates a non-specific band. A representative of three independent experiments is shown. b RNA from WABS fibroblasts and three control fibroblasts was analyzed for DDX11 expression by qRT-PCR in five independent experiments. c WABS cells were treated with 500 nM marizomib for 5 h to inhibit proteasomal degradation and analyzed by western blot. Cdc6 was included as a positive control. A representative of two independent experiments is shown. d WABS01 cells were stably transfected with cDNAs encoding either WT-DDX11 or several patient-derived DDX11 mutants and DDX11 protein levels were analyzed by western blot. A representative of three independent protein analyses is shown. e Cells were treated with 62.5 µg/mL cycloheximide for 3 h to inhibit protein synthesis and analyzed by western blot. Bands were quantified using Image Lab software, normalized to tubulin and the decrease of DDX11 protein levels during the cycloheximide treatment was determined for each mutant. f, g Similarly, protein degradation was inhibited by treatment with marizomib (500 nM, 5 h) or with the lysosome inhibitor chloroquine (25 µM, 24 h). Increase of DDX11 protein levels during the treatment was determined for each mutant. Examples of western blots that were quantified in (e), (f), and (g) are provided in Supplementary Fig. 3b–d. h DDX11 expression and localization in WABS01 cells expressing different DDX11 versions were assessed by immunofluorescence. Two independent experiments were performed, showing comparable results. i RPE1-hTERT cells and four WABS fibroblasts were transfected with indicated siRNAs (day 1 and day 4) and analyzed for cohesion defects seven days after the first transfection. Accompanying qRT-PCR (Supplementary Fig. 4a) was performed to determine knockdown efficiency, which is indicated as percentage in the figure. Per condition, in total 150 metaphases from three independent experiments were assessed.

