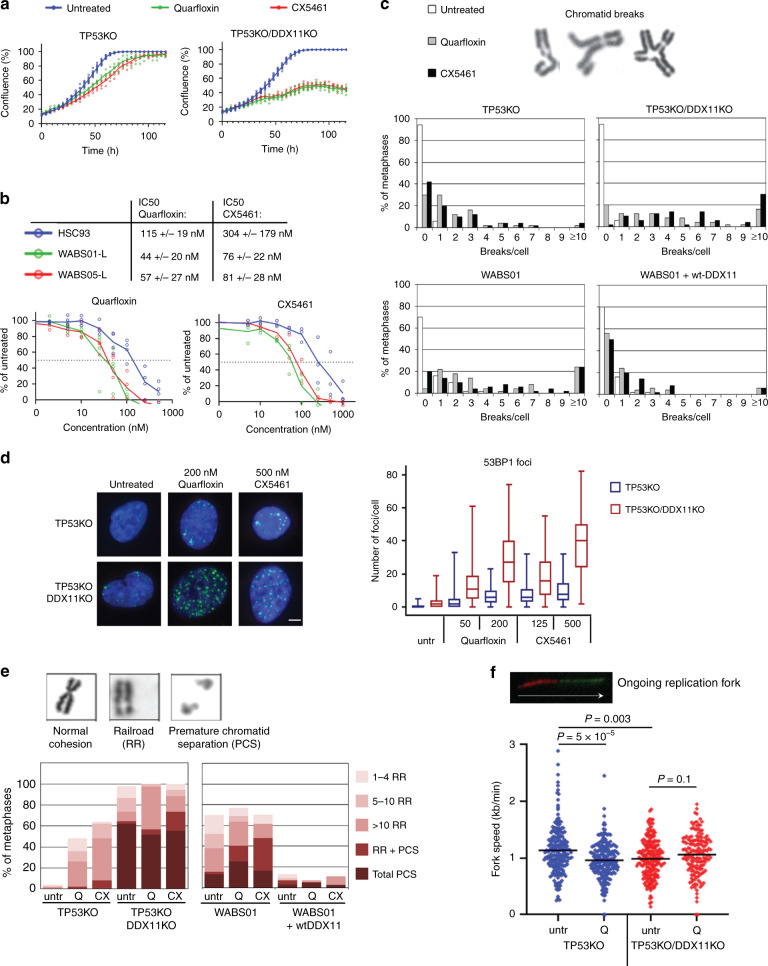
Fig. 6. DDX11 confers resistance to G-quadruplex stabilization.
a Cells were cultured in 96-wells plates and treated with 200 nM quarfloxin or 500 nM CX5461. Growth was monitored using IncuCyte software in three technical replicates. b WABS01, WABS05 and HSC93 control lymphoblasts were continuously exposed to increasing concentrations quarfloxin or CX5461. After three population doublings of untreated cells, cells were counted and plotted as percentage of untreated cells. Data from three independent experiments are shown. IC50 values from each dose-response curve were determined using curve fitting and shown as averages ± standard deviations. c Cells were treated with 200 nM quarfloxin or 500 nM CX5461 for 24 h and chromosomal breaks were scored in 50 metaphase spreads per condition. d Cells were treated as indicated and 53BP1 staining was analyzed by immunofluorescence. In total at least 85 cells per condition were counted for two independent experiments. Boxes extend from the 25th to the 75th percentile, whiskers from the smallest to the largest value, lines indicate the median. e Cells were treated with 200 nM quarfloxin or 500 nM CX5461 for 24 h and cohesion defects were analyzed in 50 metaphases per condition. f Cells were treated with 200 nM quarfloxin (Q) for 24 h and assessed with a DNA fiber assay using a double labeling protocol. In total at least 165 fibers were scored per condition in two independent experiments. The example track represents an ongoing fork. Black lines indicate the mean. P-values were calculated by a non-parametric one-way ANOVA test.

