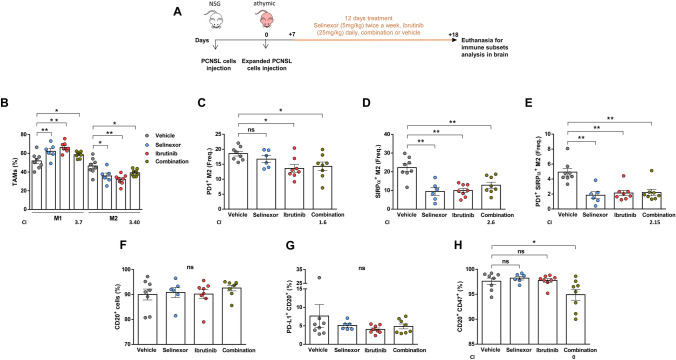
Fig. 6.
Treatment with selinexor and ibrutinib favors M1-like response in tumor-associated macrophages in CNS lymphoma PDXs. a Scheme representing mice treatment and monitoring. b Percentage of M1 and M2 TAMs by flow cytometry. Frequency of M2 macrophages that express PD-1 (c), SIRPα (d) or co-express both markers (e). f Percentage of CD20+ cells in the brains from mice. g Percentage of malignant cells CD20+ expressing PD-L1 in the different treatment groups. Percentage of malignant cells expressing CD47 (h) and co-expressing PD-L1 and CD47 (i). (*P < 0.05, **P < 0.01, ***P < 0.001, Mann–Whitney test. Graphs show mean ± SEM). CI combination index

