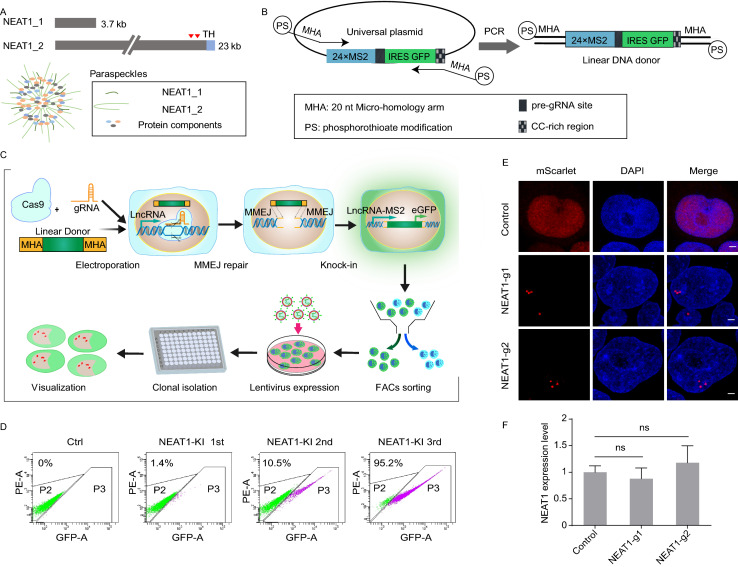
Figure 1.
Targeting endogenous NEAT1 lncRNA by MMEJ-mediated CRISPR knock-in. (A) Schematic of NEAT1 isoforms and paraspeckle structure. NEAT1 contains two isoforms as indicated, and the longer isoform NEAT1_2 plays an architectural role in the assembly of paraspeckle with other RBPs. NEAT1 transcripts are radially arranged perpendicular to the longer axis of paraspeckles with the 5′ and 3′ ends of the transcripts facing outward. The red inverted triangles indicate the targeted site of the gRNA-1 and gRNA-2. TH indicates the triple helix structure of NEAT1_2. (B) Schematic of one-step generation of linear DNA donor for MMEJ-based CRISPR knock-in. The PCR primers contain 20 nt MHAs around the cleave site and 25-30 nt overlapping region of the universal template plasmid. PS indicates phosphorothioate modification between the last 5 nt at the 5′ end of PCR primers. The universal template of the plasmid mainly contains 24×MS2-IRES-GFP cassette, and the IRES-GFP fragment is flanked with a pre-gRNA site and a CC-rich region for further cleavage. (C) Workflow of CERTIS labeling in target lncRNA genomic locus. The workflow includes electroporation of Cas9 RNP and linear DNA donor, FACs enrichment of GFP positive cells, stable expression of tdMCP-mScarlet-3×Flag cassette, clonal isolation and identification of correctly KI clones. (D) Enrichment of NEAT1 KI cells by GFP FACs sorting. Representative images showed consecutive FACs sorting were proceeded to isolate the GFP positive cells. P3 was the gate for GFP positive selection. After three rounds of sorting, the cell population was nearly 100% GFP positive. (E) Visualization of endogenous NEAT1 (red) by lentiviral expression of tdMCP-mScarlet-3×Flag in both KI cell lines. Cells were fixed and stained with DAPI (blue). WT HEK293T cells stably expressing the tdMCP cassette were used as control. Scale bar: 2 μm. (F) Expression level of NEAT1 was measured by RT-qPCR in WT HEK293T and the two KI cell lines. No significant difference was detected in expression between WT and KI cell lines. ns, no significant difference, determined by two-tailed Student’s t test. The error bars represent standard deviation from three parallel experiments

