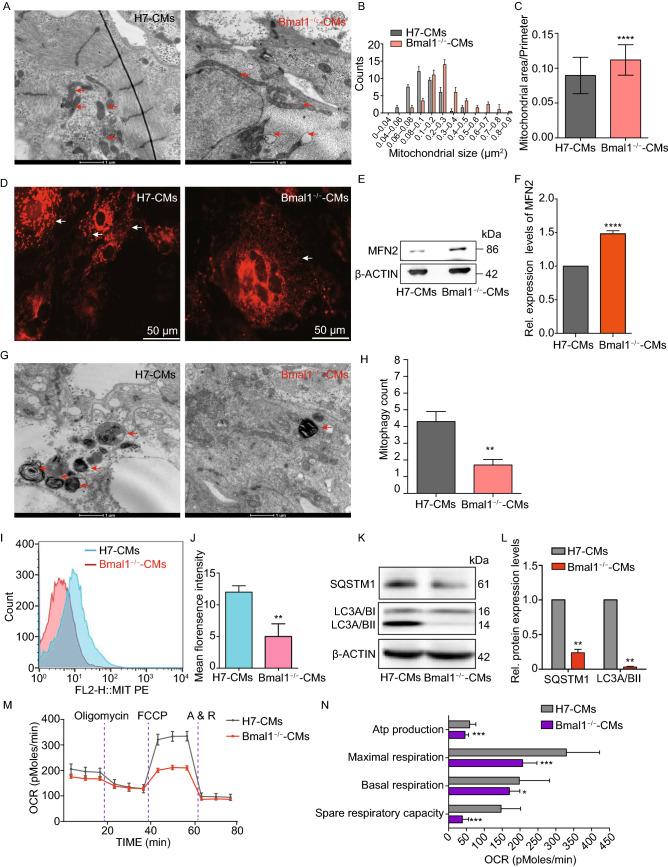
Figure 5.
BMAL1 KO hESC-derived cardiomyocytes exhibited mitochondrial hyperfusion and compromised mitochondrial autophagy. (A) Representative transmission electron micrographs of mitochondria (red arrows) from wild type and BMAL1 KO hESC-derived cardiomyocytes day 35 post differentiation. Mitochondrial enlargement in BMAL1 KO hESC-derived cardiomyocytes was apparent. (B) Quantification of mitochondrial size in wild type and BMAL1 KO hESC-derived cardiomyocytes day 35 post differentiation. (C) Quantification of the ratio of mitochondrial area-perimeter indicated mitochondrial fusion level (enlarged and fused mitochondria possess greater area-perimeter ratio) was upregulated in BMAL1 KO hESC-derived cardiomyocytes (n = 40). (D) Representative confocal images showing RFP-tagged mitochondria (white arrows) in wild type and BMAL1 KO hESC-derived cardiomyocytes day 35 post differentiation. Cox8a-RFP adenovirus was used to tag mitochondria. (E) Western blot analysis of level of Mfn2 proteins regulating mitochondrial dynamics. (F) Quantification of Western blot signals in (E) and normalized to the loading control (α-ACTIN). (G) Transmission electron microscopy examining alterations in mitochondrial autophagy (red arrows) in wild type and BMAL1 KO hESC-derived cardiomyocytes day 35 post differentiation. (H) Mitophagy was counted in 10 different transmission electron images of wild type and BMAL1 KO hESC-derived cardiomyocytes day 35, respectively. (I) Mitophagy intensity in wild type and BMAL1 KO hESC-derived cardiomyocytes day 35 post differentiation analyzed by flowcytometry. (J) Mean intensity of BMAL1 KO hESC-derived cardiomyocytes was markedly decreased. (K) Western blot evaluation of protein expression level of SQSTM1 and LC3A/B-II in wild type and BMAL1 KO hESC-derived cardiomyocytes day 35 post differentiation. (L) Quantification of Western blot signals in (I) and normalized to the loading control (α-ACTIN). n = 3 for each group. (M) Real-time respiration measurements of wild type and BMAL1 KO hESC-derived cardiomyocytes day 35 post differentiation. (N) Statistics of respiration parameters between wild type and BMAL1 KO hESC-derived cardiomyocytes day 35 post differentiation. n = 4 for each group. Data were represented as mean ± SD. *P < 0.05, **P < 0.01, ***P < 0.001, ****P < 0.0001 versus control by two-tailed Student’s t test

