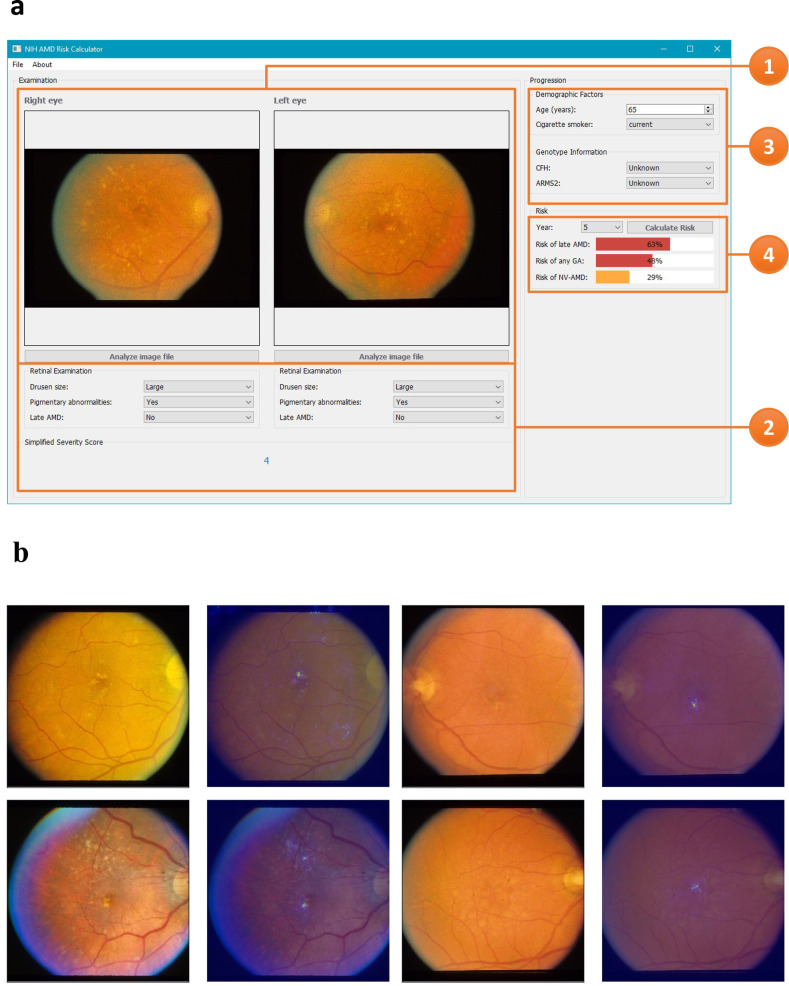
Fig. 4. A screenshot of our research prototype system for AMD risk prediction.
a Screenshot of late AMD risk prediction. 1, Upload bilateral color fundus photographs. 2, Based on the uploaded images, the following information is automatically generated separately for each eye: drusen size status, pigmentary abnormality presence/absence, late AMD presence/absence, and the Simplified Severity Scale score. 3, Enter the demographic and (if available) genotype information, and the time point for prediction. 4, The probability of progression to late AMD (in either eye) is automatically calculated, along with separate probabilities of geographic atrophy and neovascular AMD. b Four selected color fundus photographs with highlighted areas used by the deep learning classification network (DeepSeeNet). Saliency maps were used to represent the visually dominant location (drusen or pigmentary changes) in the image by back-projecting the last layer of neural network.

