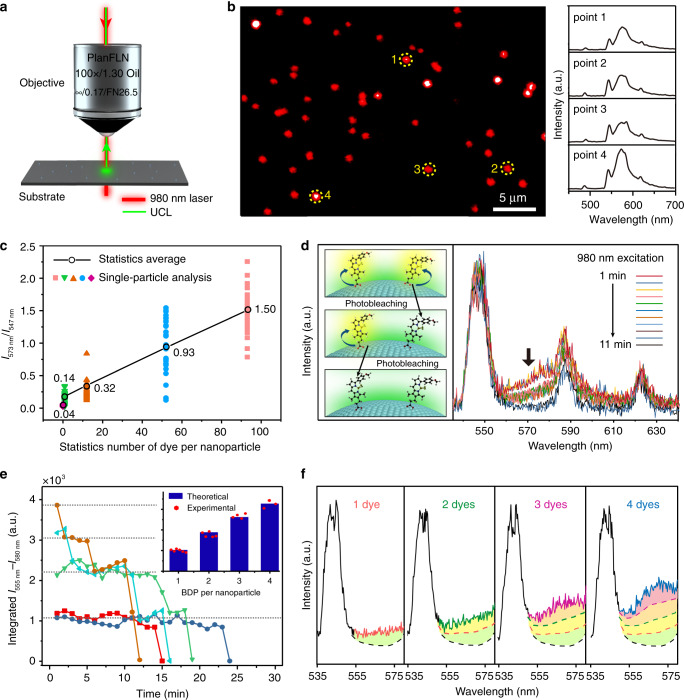
Fig. 3. Single-particle characterization of BDP dye-modified upconversion nanoparticles through i-SET spectroscopy.
a Schematic of the experimental design for detecting single-upconversion luminescence (UCL) from of dye-decorated upconversion nanoparticles using a confocal microscope imaging system. b A typical confocal microscope image of NaYbF4:Tb(40 mol%)@NaTbF4 nanoparticles loaded with an average of ~92 BDP molecules per nanoparticle (left panel), and corresponding single-particle upconversion luminescence spectra (right panel) recorded at the points marked with yellow dashed circles. c Plots of sensitized BDP emission to Tb3+ emission intensity ratios measured at single-particle level from a series batches of BDP-decorated NaYbF4:Tb(40 mol%)@NaTbF4 nanoparticles with different average coverage ratios of dye molecules. Each of the colour dots represent an individual spectral measurement from a randomly picked nanoparticle, and the black circles represent the average ratios of individual measurements from the same sample glass substrates. d Time-dependent upconversion luminescence spectra of a typical BDP-decorated upconversion nanoparticle showing discrete two-steps photobleaching of sensitized BDP emission at around 573 nm under 980 nm irradiation. The inserted scheme illustrates the step-wise single-molecule photobleaching of two BDP molecules at the surface of a nanoparticle. e Time-dependent integrated emission intensity changes of BDP recorded from several individual single-particle measurements. The inset shows a comparison between the theoretically calculated dye emission intensity ratios and the experimental intensity ratios extracted from the single-particle measurements. f Single-particle upconversion luminescence spectra of individual NaYbF4:Tb(40 mol%)@NaTbF4 nanoparticles conjugated with 1, 2, 3, and 4 active dye molecules, respectively. The nanoparticle-sensitized BDP emissions are highlighted in colours.

