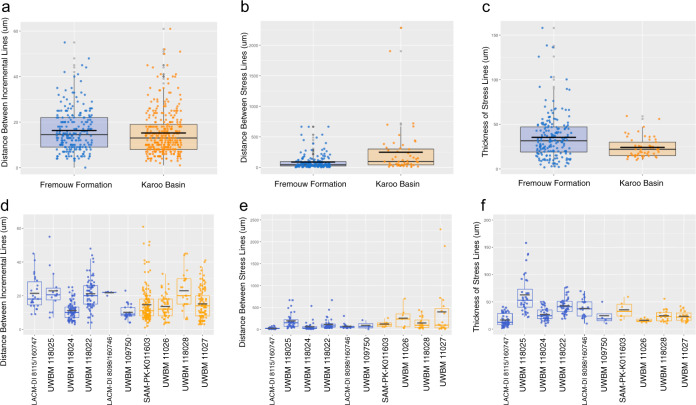
Fig. 2. Stress and regular incremental data for Antarctic (blue) and South African (orange) Lystrosaurus tusks.
a The mean distance between regular incremental growth marks was insignificantly different between the two populations (p = 0.06543; n = 550) suggesting similar baseline metabolic activity in Antarctic and South African Lystrosaurus populations. b The distance between growth marks was significantly greater in South African specimens (p = 7.43e-05; n = 234) indicating longer durations of uninterrupted growth. c The thickness of stress lines in Antarctic specimens was significantly greater than South African specimens (p = 1.45e-03; n = 246) indicating longer periods of inactive growth. d–f Measurements averaged in a–c separated by data collected for each specimen. Considerable variation was observed, but even with outliers removed, the average significant differences remained consistent.

