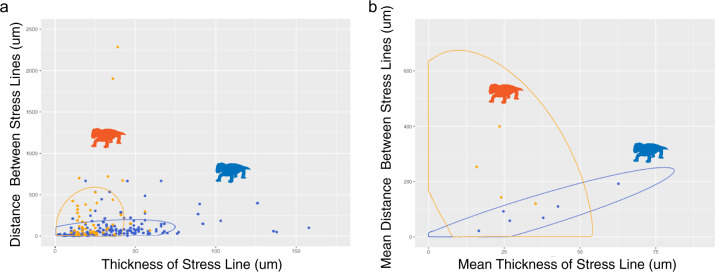
Fig. 4. Comparative measurements of stress lines in Antarctic (blue) and South African (orange) tusks.
There is substantial variability within each population, however, South African stress lines tend to be thinner and farther apart than Antarctic specimens which are more likely to occur closer together and more frequently. This is apparent as individual data points (a) and when specimens are assigned a mean value for these measurements (b).

