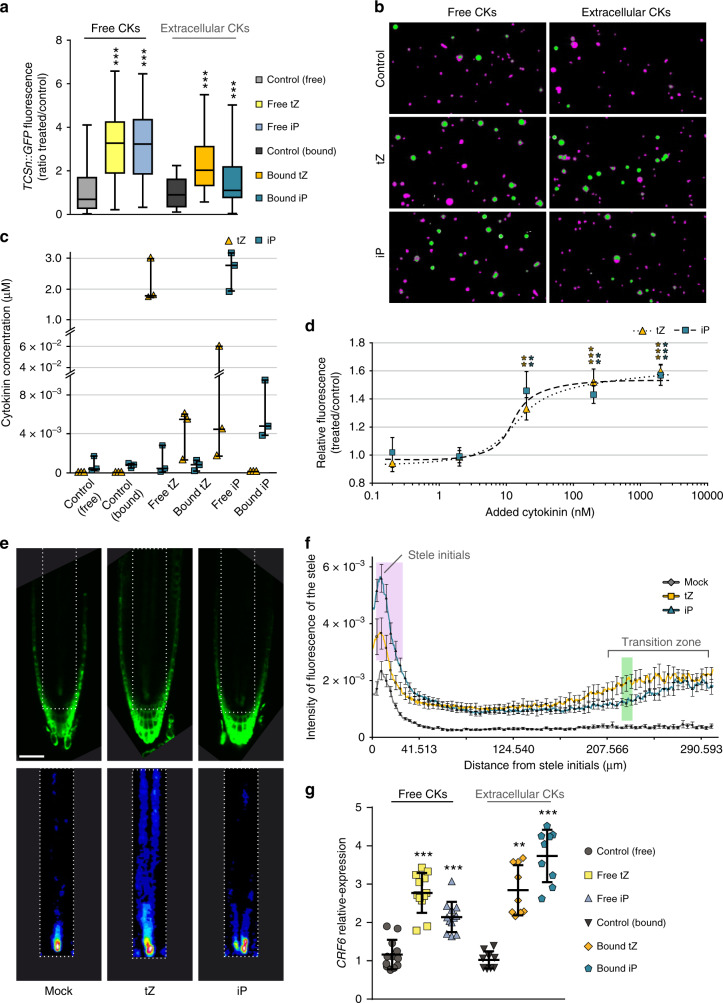
Fig. 3. Extracellular cytokinins activate cytokinin responses.
a Quantification of GFP fluorescence in protoplasts, derived from roots of 6-day-old TCSn::GFP seedlings, after treatment with or without free cytokinins (tZ or iP, 2 μM, denoted “free“) or immobilised cytokinins (tZ or iP, ligand mean density 10 μmol l−1 equivalent, attached to Sepharose beads, denoted “bound”, also referred to as extracellular compounds). Negative controls without added cytokinin were incubations with and without beads (control free and bound, respectively). Whiskers represent the entire range of values, boxes indicate first and third quartiles, centre line is median); ***p < 0.001 by one-way ANOVA and Tukey’s test, indicating significant differences in fluorescence intensity between control and corresponding free or extracellular cytokinin treatments. Three independent experiments were performed, with each comprising data from n > 20 images, corresponding to >1000 protoplasts. Cytokinin treatment was for 16 h then 1 μM FM4-64 applied 5 min prior to confocal imaging. See also Supplementary Figs. 5–7b. b Images of the treated protoplast samples described in a. GFP (green) and FM4-64 (magenta) channels are overlaid. c Quantification of iP and tZ in the remaining protoplast samples after the 16 h cytokinin treatment from the experiments described in a. Dots are individual values; whiskers represent the entire range of values, boxes indicate first and third quartiles, centre line is mean. d Dose-response of GFP intensity in protoplasts of TCSn::GFP root protoplasts treated with 0.2, 2, 20, 200 or 2000 nM free tZ or iP for 16 h. Data are shown as ratio of treated/control. Error bars are s.e.m. and asterisks indicate significant differences in TCSn::GFP response (**p < 0.01; ***p < 0.001 by homoscedastic t-test). Other details as for a. e, f Responses of 6-day-old TCSn::GFP-expressing roots to treatment with 2 μM tZ or iP for 16 h. e Confocal images of roots, scale bar 54 μm. Top panels are GFP intensity signal; bottom panels show the respective root vasculature in 16-colour LUT (Look-Up Tables; https://imagej.net/) to better highlight regions with enhanced cytokinin response. f Quantification of GFP fluorescence intensity in the stele (n ≥ 11). Results are combined from two independent experiments, with the fluorescent signal of ten roots quantified in each experiment using ImageJ. Error bars are s.e.m. Both cytokinins significantly enhanced TCSn::GFP response compared with controls, while the highlighted areas in magenta (iP > tZ) and green (tZ > iP) show significant differences between tZ and iP responses (p < 0.05, homoscedastic t-test). g qRT-PCR analysis of expression of Cytokinin Response Factor 6 (CRF6) induced by free and extracellular bound cytokinins (experimental setup as in a). Dots are individual values, whisker represents s.d., centre line is mean. Data are relative expression by the 2−ΔΔCt method. Asterisks indicate values significantly different from the corresponding control treatment (**p < 0.01; ***p < 0.001 by Mann–Whitney U test). Four biological replicates were analysed in triplicate.

