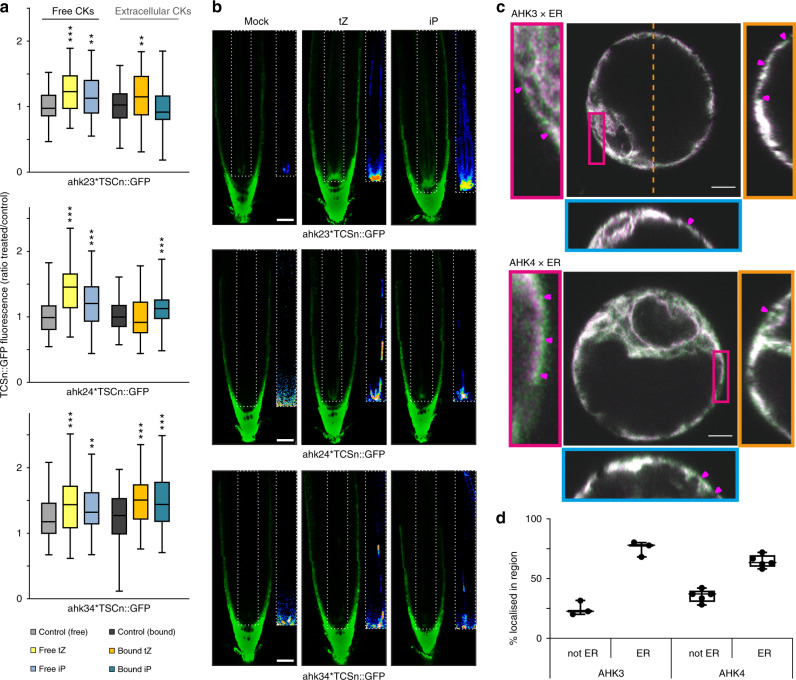
Fig. 4. Cytokinin responses when only one AHK receptor is active, and receptor localisation.
a Quantification of GFP fluorescence in protoplasts derived from roots of 6-day-old TCSn::GFP seedlings in wild type (Col-0), ahk3,4, ahk2,3 and ahk2,4 backgrounds, after treatment for 16 h with or without free cytokinins (tZ or iP, 2 μM, denoted “free”) or immobilised cytokinins (tZ or iP, ligand mean density 10 μmol l−1 equivalent, attached to Sepharose beads, denoted “bound”). Negative controls without added cytokinin were incubations with and without beads (control free and bound, respectively). Whiskers indicate entire range of values, box indicates first and third quartiles, and central line is mean; **p < 0.01; ***p < 0.001 by one-way ANOVA and Tukey’s test, indicating significant differences in fluorescence intensity between control and corresponding free or extracellular cytokinin treatments. Three independent experiments were performed with each comprising data from n > 20 images, corresponding to >1000 protoplasts. See also Supplementary Figs. 7 and 10. b Confocal images of roots from ahk3,4, ahk2,3 and ahk2,4 double mutants expressing TCSn::GFP, after treatment for 24 h with 100 nM tZ or iP. Scale bar is 39 μm. The inset panels show the respective root vasculature in 16-colour LUT (Look-Up Tables; https://imagej.net/) highlighting the gradations of fluorescence intensity. c 3D Airyscan images of Arabidopsis protoplasts expressing AHK3–GFP (green; above) and AHK4–GFP (below) and the ER maker RFP-p24δ5 (magenta). The left panel shows a zoomed in region of the cell (red rectangle). The right panel depicts the YZ orthogonal view of the Z-stack (orange dashed line). The bottom panel shows the XZ orthogonal view of the Z-stack (blue dashed line). Magenta arrows indicate regions of AHK-only signal on the cell surface. Scale bars, 5 µm. d Quantitative analysis of AHK-GFP signal co-localising or not co-localising with ER marker RFP-p24δ5. Whiskers represent entire range of values, boxes indicate first and third quartiles, central line is median and dots are values for individual cells. n = 3 for AHK3, n = 5 for AHK4.

