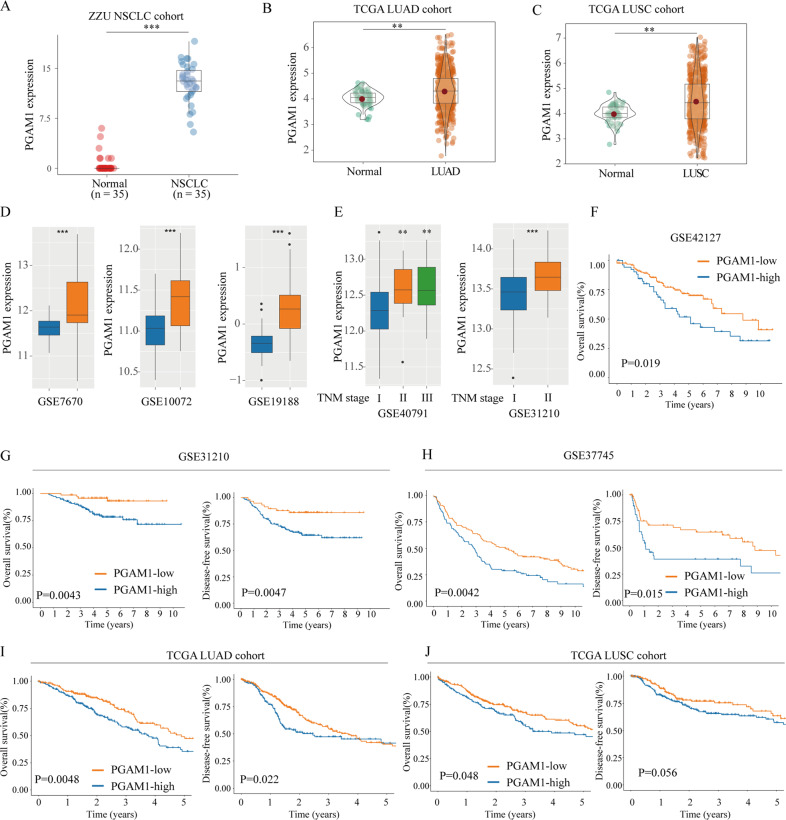
Fig. 1. PGAM1 mRNA is upregulated in NSCLC based on TCGA analysis.
PGAM1 mRNA expression levels in NSCLC tissues or non-tumor control tissues were analyzed by QT-PCR in 30 paired NSCLC specimens (a). PGAM1 mRNA expression levels were analyzed in LUAD and LUSC tissues from TCGA databases (b, c), and three independent GEO datasets (d). Expression of PGAM1 in different TNM stage (e). Overall survival (OS) and disease-free survival (DFS) rates analysis of the NSCLC patients in GSE42127 (f), GSE31210 (g), GSE37745 (h) and TCGA cohort (i, j). *p < 0.05, **p < 0.01, ***p < 0.001.

